fadi
FADI - Ingest, store and analyse big data flows
FADI User guide
This page provides documentation on how to use the FADI big data framework using a sample use case: monitoring CETIC offices building.
- 1. Install FADI
- 2. Prepare the database to store measurements
- 3. Ingest measurements
- 4. Display dashboards and configure alerts
- 5. Explore
- 6. Process
- 7. Summary

In this simple example, we will ingest temperature measurements from sensors, store them and display them in a simple dashboard.
1. Install FADI
To install the FADI framework on your workstation or on a cloud, see the installation instructions. The following instructions assume that you deployed FADI on your workstation inside minikube.
The components needed for this use case are the following:
- Apache Nifi as a integration tool to ingest the sensor data from the data source (a csv file in this case) and store it in the database
- PostgreSQL as both a datawarehouse and datalake, with Adminer as a management web interface
- Grafana as a dashboard tool to display graphs from the data ingested and stored in the datalake
- Apache Superset as a exploration dashboard tool
- JupyterHub as a web interface to explore the data using notebooks
- Traefik as ingress controller
Those components are configured in the following sample config file, once the platform is ready you can start working with it.
To access services through domain names, open a new terminal and enter this command to give Traefik an external IP address:
minikube tunnel
Update your hosts file with Traefik’s external IP address:
$ kubectl get svc -n fadi
NAME                      TYPE           CLUSTER-IP       EXTERNAL-IP     PORT(S)                      AGE
fadi-traefik              LoadBalancer   10.104.68.59     10.104.68.59    80:31633/TCP,443:30041/TCP   59m
You can find here a user guide for Linux, Mac and Windows. Your host file should look like this:
127.0.0.1   localhost
...
10.104.68.59 grafana.example.cetic.be adminer.example.cetic.be superset.example.cetic.be nifi.example.cetic.be
Unless specified otherwise, all services can be accessed using the username and password pair: admin / Z2JHHezi4aAA , see the user management documentation for detailed information on how to configure user identification and authorization (LDAP, RBAC, …).
See the logs management documentation for information on how to configure the management of the various service logs.
2. Prepare the database to store measurements

First, setup the datalake by creating a table in the PostgreSQL database.
To achieve this you need to:
-
Head to the Adminer interface
- if you want to create a Traefik ingress, you can follow this guide
- else, you can use a port-forwarding to access the interface:
kubectl port-forward service/fadi-adminer 8081:80and can access Adminer from your browser at http://localhost:8081
-
Access to the Adminer service and to the PostgreSQL database using the following credentials:
- System:
PostgreSQL - Server:
fadi-postgresql - Username:
admin - Password:
Z2JHHezi4aAA - Database:
postgres
- System:
-
In the Adminer Browser, launch the Query tool by clicking “SQL command”.
-
Copy/Paste the table creation script in the Query Editor.
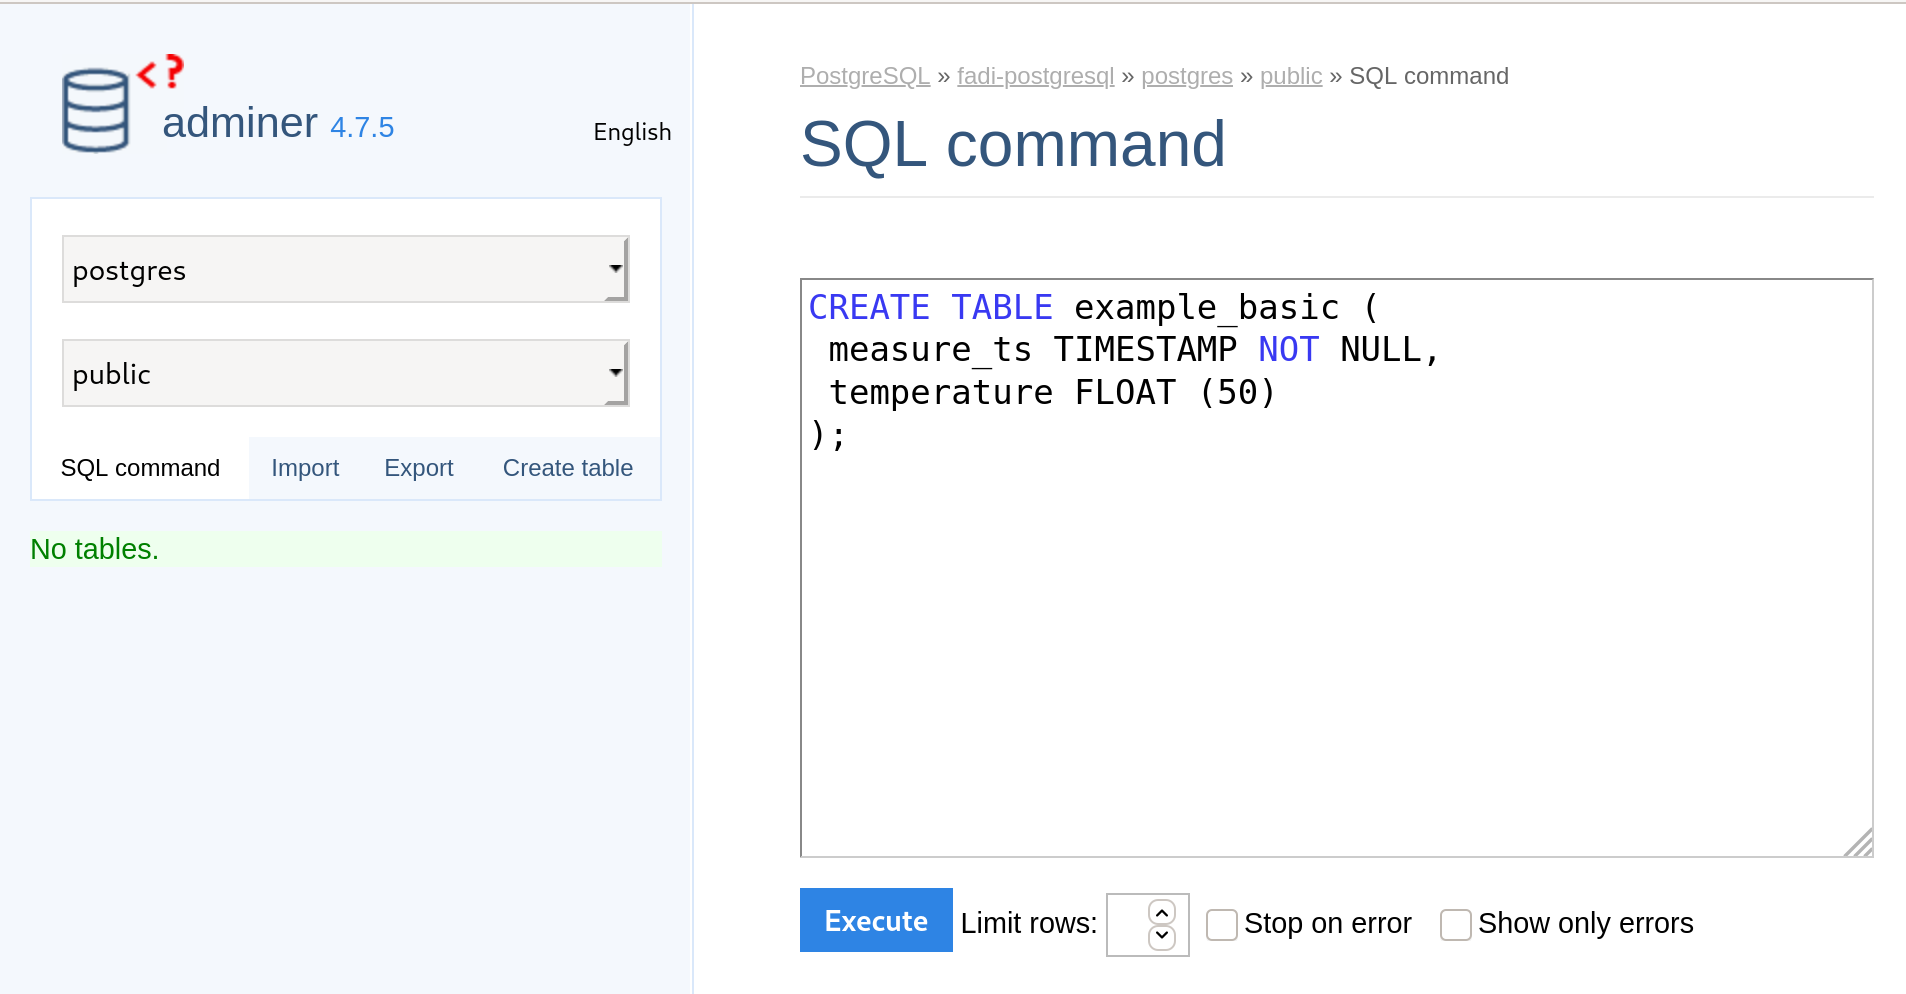
-
Execute the creation query by clicking on the
Executecommand. -
Once the previous steps are finished, you can detect that a new table
example_basicis created in theTablesfield of adminer Browser.
3. Ingest measurements

“An easy to use, powerful, and reliable system to process and distribute data.”
Apache Nifi provides ingestion mechanism (to e.g. connect a database, REST API, csv/json/avro files on a FTP, … for ingestion): in this case we want to read the temperature sensors data from our HVAC system and store it in a database.
Temperature measurements from the last 5 days (see HVAC sample temperatures csv extract) are ingested:
measure_ts,temperature
2019-06-23 14:05:03.503,22.5
2019-06-23 14:05:33.504,22.5
2019-06-23 14:06:03.504,22.5
2019-06-23 14:06:33.504,22.5
2019-06-23 14:07:03.504,22.5
2019-06-23 14:07:33.503,22.5
2019-06-23 14:08:03.504,22.5
2019-06-23 14:08:33.504,22.5
2019-06-23 14:09:03.503,22.5
2019-06-23 14:09:33.503,22.5
2019-06-23 14:10:03.503,22.5
2019-06-23 14:10:33.504,22.5
2019-06-23 14:11:03.503,22.5
2019-06-23 14:11:33.503,22.5
2019-06-23 14:12:03.503,22.5
2019-06-23 14:12:33.504,22.5
2019-06-23 14:13:03.504,22.5
2019-06-23 14:13:33.504,22.5
2019-06-23 14:14:03.504,22.5
(...)
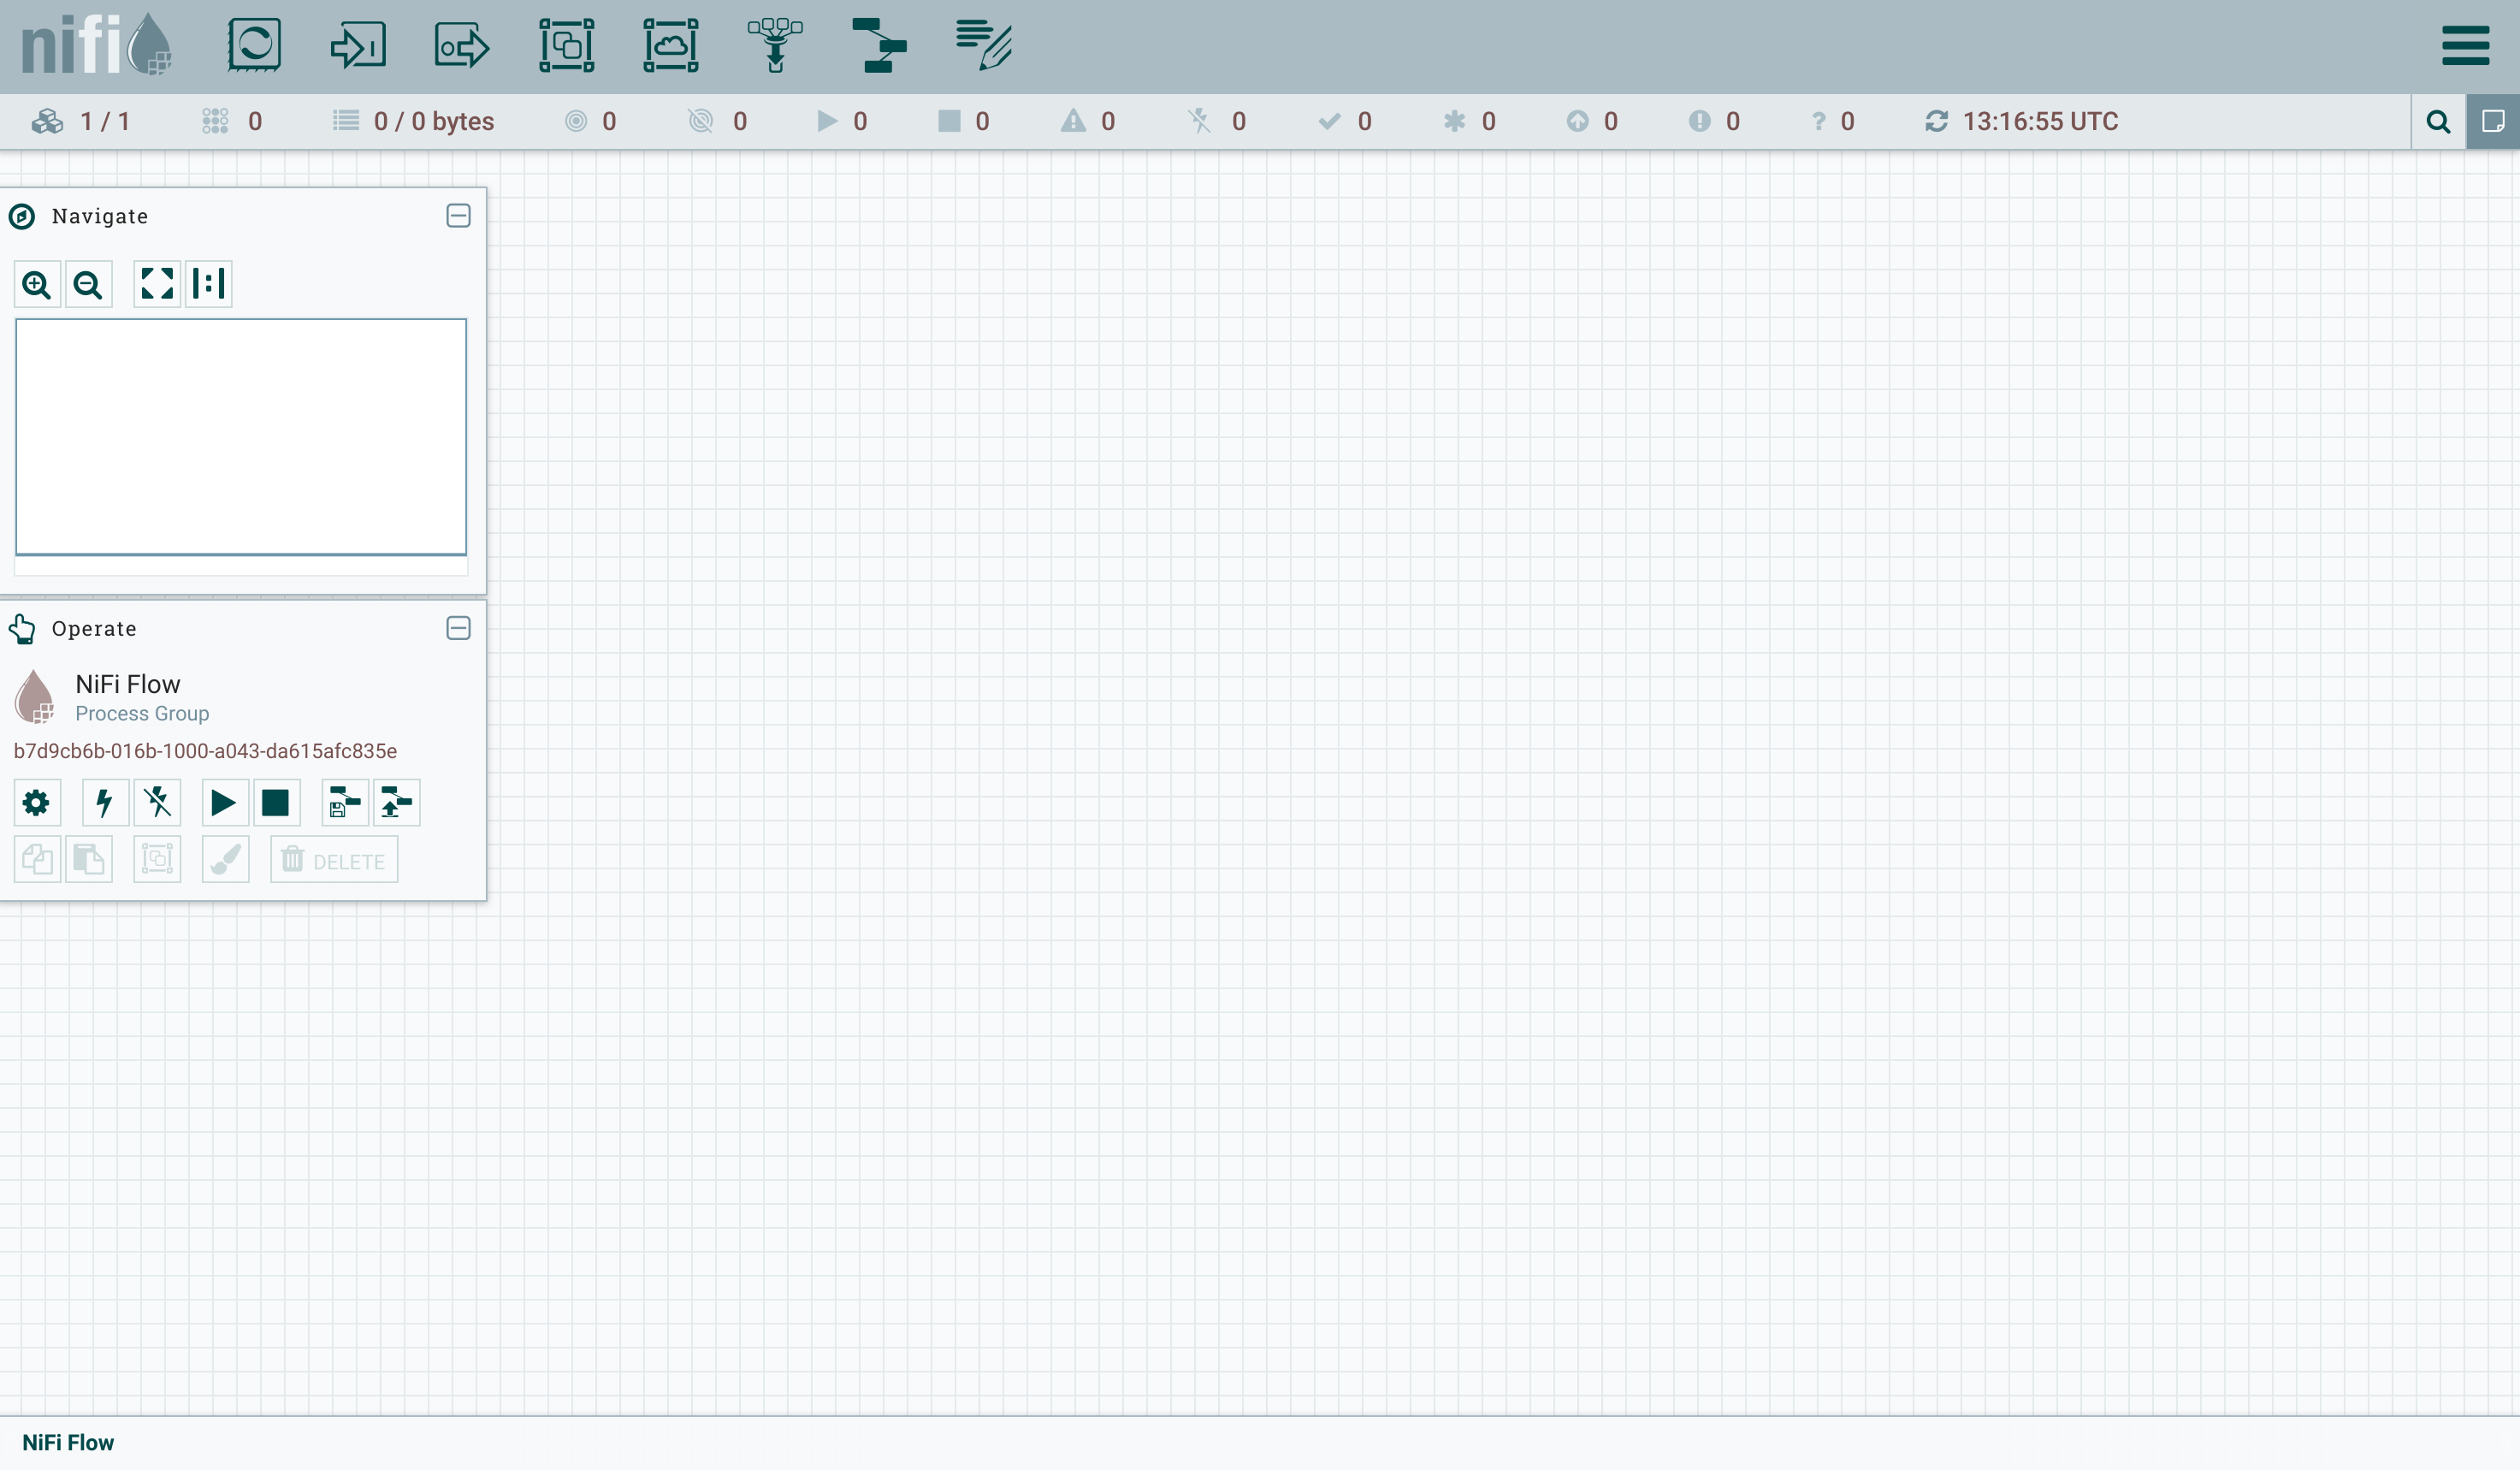
To start, head to the Nifi web interface, type in your browser the nifi.traefikIngress.host. E.g. :
Then, you can login using the default credentials username/changemechangeme.
A Nifi dashboard is shown.
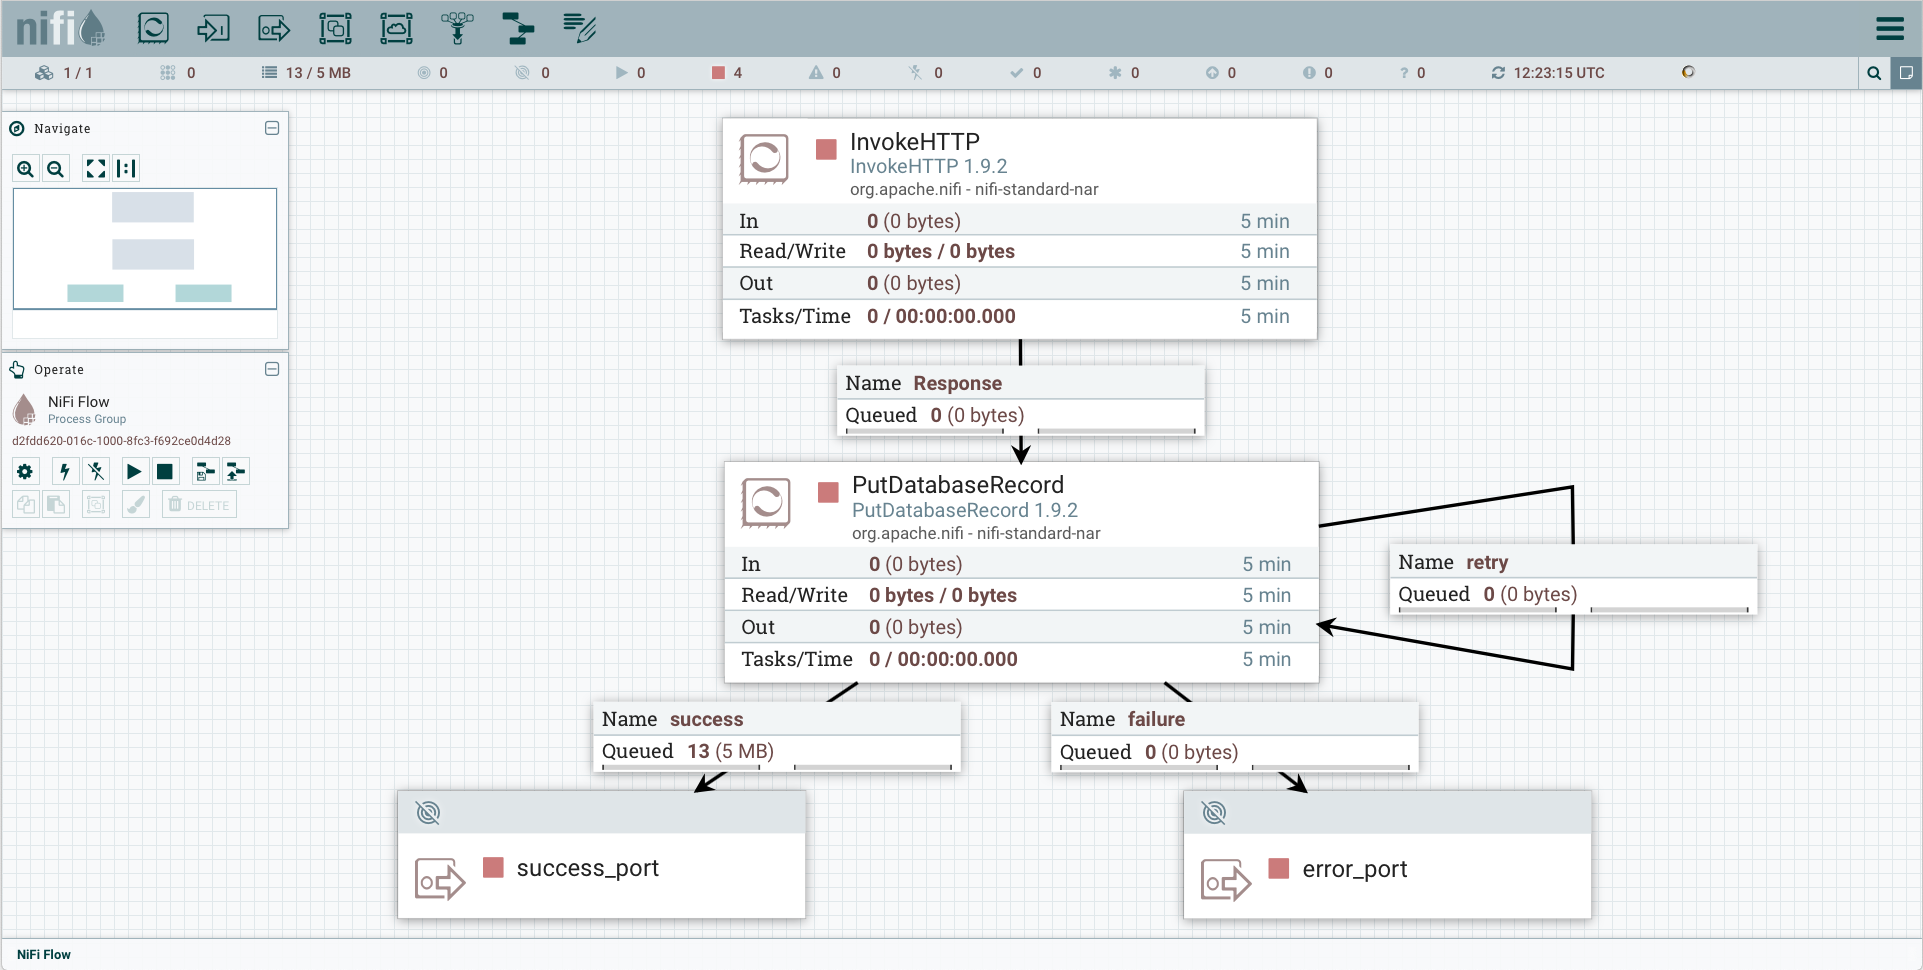
Now we need to tell Nifi to read the csv file and store the measurements in the data lake.
So, create the following components :
- InvokeHTTP processor:
- right-click >
Configure>Settingstab >Automatically Terminate Relationships: all exceptResponse - right-click >
Configure>Propertiestab > Remote url:https://raw.githubusercontent.com/cetic/fadi/master/examples/basic/sample_data.csv - right-click >
Configure>Schedulingtab > Run Schedule: 120s (this will download the sample file every 120 seconds)
- right-click >
- PutDatabaseRecord processor:
- right-click >
Configure>Settingstab >Automatically Terminate Relationships: all - right-click >
Configure>Propertiestab > Record Reader >Create a new service>CSV ReaderGo To>Configure>Properties>- Treat First Line as Header:
true
- right-click >
Configure>Propertiestab > Statement Type:INSERT - right-click >
Configure>Propertiestab > Database Connection Pooling Service > DBCPConnectionPoolGo To>Configure>Properties>- Database Connection URL:
jdbc:postgresql://fadi-postgresql:5432/postgres?stringtype=unspecified - Database Driver Class Name:
org.postgresql.Driver - Database Driver Location(s):
/opt/nifi/psql/postgresql-42.2.6.jar - Database User:
admin - Password:
Z2JHHezi4aAA - Enable service by clicking on the lightning icon.
- Database Connection URL:
- right-click >
Configure>Propertiestab > Schema Name >public - right-click >
Configure>Propertiestab > Table Name >example_basic - right-click >
Configure>Propertiestab > Translate Field Names >false - Now we need to enable the controller services:
- Click anywhere on the Nifi workbench.
- Click on the
configurationbutton. - Enable both controller services.
- right-click >
- Response Connection:
- Create an edge from
InvokeHTTPprocessor toPutDatabaseRecord - Details > For relationships >
Response
- Create an edge from
- Output Port:
- Port Name > :
success_port
- Port Name > :
- Output Port:
- Port Name > :
failure_port
- Port Name > :
SuccessConnection:- Create an edge from
PutDatabaseRecordtoOutput Success Port - Details > relationships > only
success
- Create an edge from
FailureConnection:- From
PutDatabaseRecordtoOutput Failure Port - Details > relationships > : only
failure
- From
- Recursive Connection on
DatabaseRecord:- Details > relationships > only
retry
- Details > relationships > only
- Select both processors and both output ports
* right-click, and select
Start.
See also the NiFi template that corresponds to this example.
- To reuse the provided template (instead of designing our own template), you can:
- Click
Upload templatein the Operate frame, select the template, and upload it. - From the Nifi menu, drag and drop the Template menu.
- Choose your uploaded template.
- In the Operate frame of Nifi:
- right-click on
Configuration - Click on
View configurationofDBCPConnectionPoolcontroller service. - In the
Propertiestab, complete thepasswordfield withZ2JHHezi4aAA - Enable both
CSVReaderandDBCPConnectionPoolcontroller services.
- right-click on
- Select both processors and both output ports
- right-click, and select
Start.
- right-click, and select
- Click
For more information on how to use Apache Nifi, see the official Nifi user guide and this Awesome Nifi resources.
Finally, start the nifi flow in the operate window.
4. Display dashboards and configure alerts
Once the measurements are stored in the database, we will want to display the results in a dashboard.

“Grafana allows you to query, visualize, alert on and understand your metrics no matter where they are stored. Create, explore, and share dashboards with your team and foster a data driven culture.”
Grafana provides a dashboard and alerting interface.
Head to the Grafana web interface by typing in your browser the grafana.traefikIngress.host. E.g. :
http://grafana.example.cetic.be
(the default credentials are admin/Z2JHHezi4aAA)
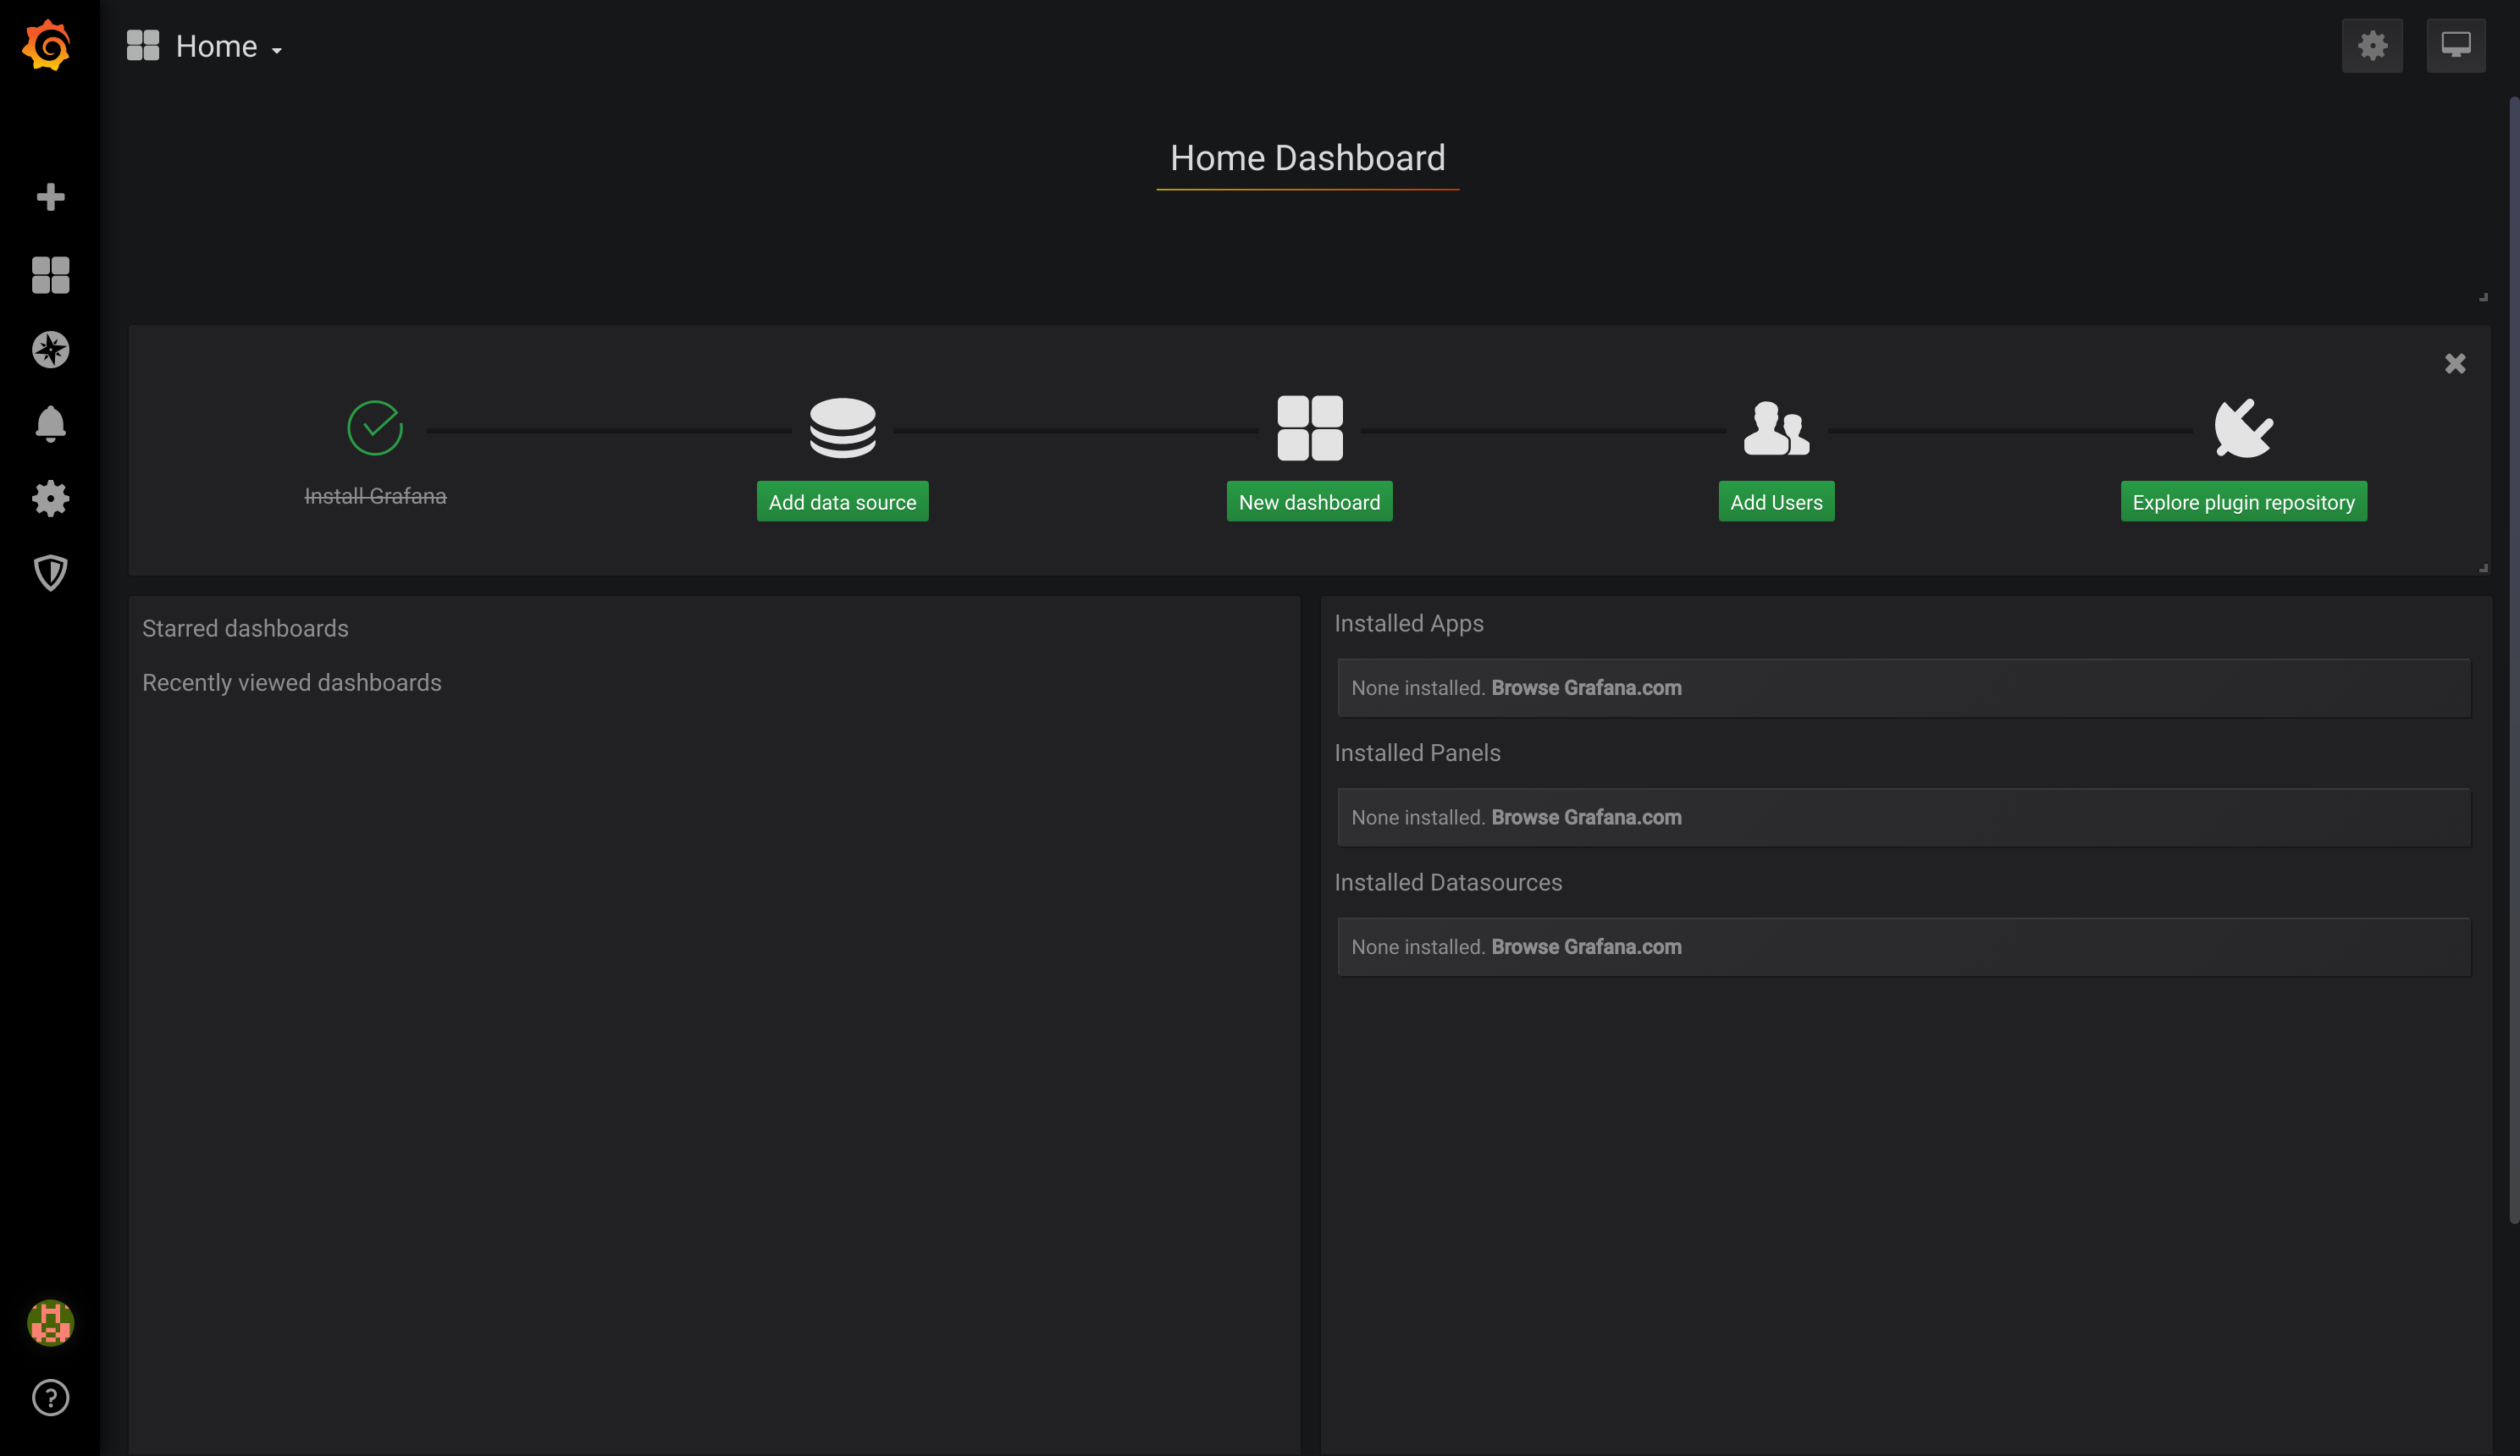
First we will define the PostgreSQL datasource. To do that, in the Grafana Home Dashboard
- Select
Add data source, - Choose data source type:
PostgreSQL, - Complete the seeting as:
- Host:
fadi-postgresql:5432 - database:
postgres - user:
admin - password:
Z2JHHezi4aAA - SSL Mode:
disable - Version:
10
- Host:
Then we will configure a simple dashboard that shows the temperatures captured in the PostgreSQL database:
- Select
New dashboard, - Select
Choose Visualization
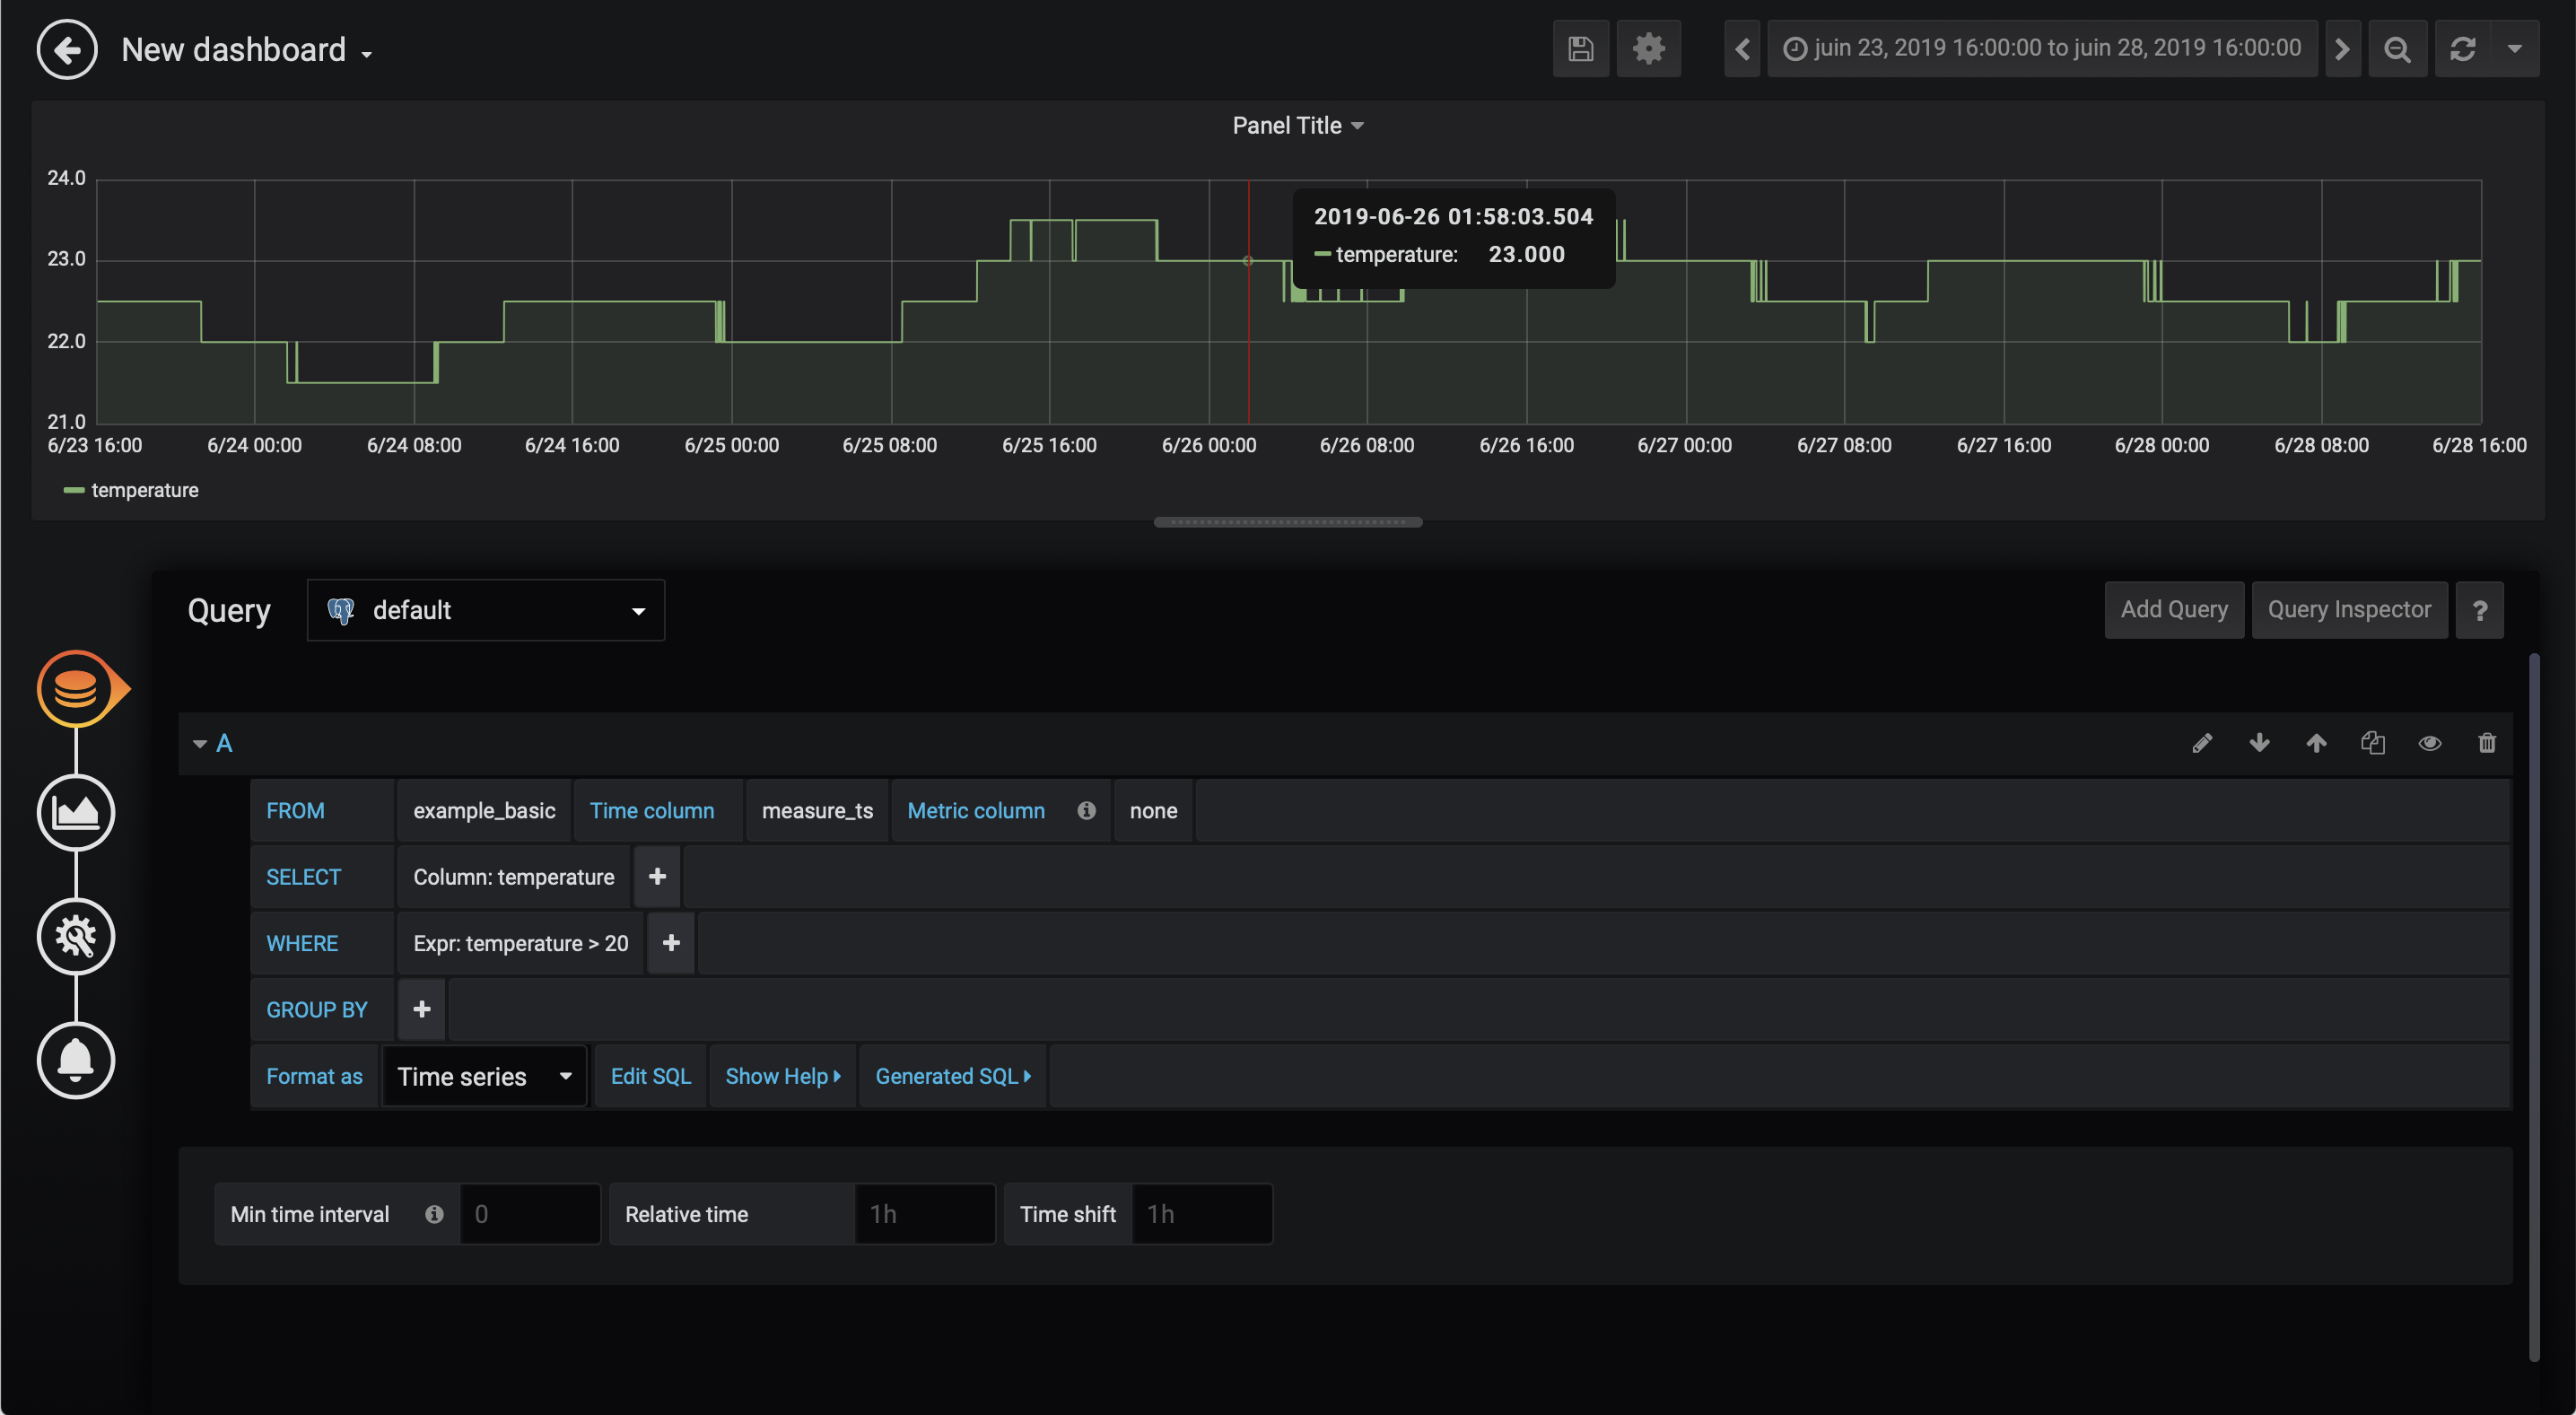
A pre-filled SQL query is provided and shown in the Queries tab.
You can complete the Where clause with the following expression: Expr: temperature > 20 for example.
To show the dashboard, it is necessary to specify a time frame between 2019-06-23 16:00:00 and 2019-06-28 16:00:00.
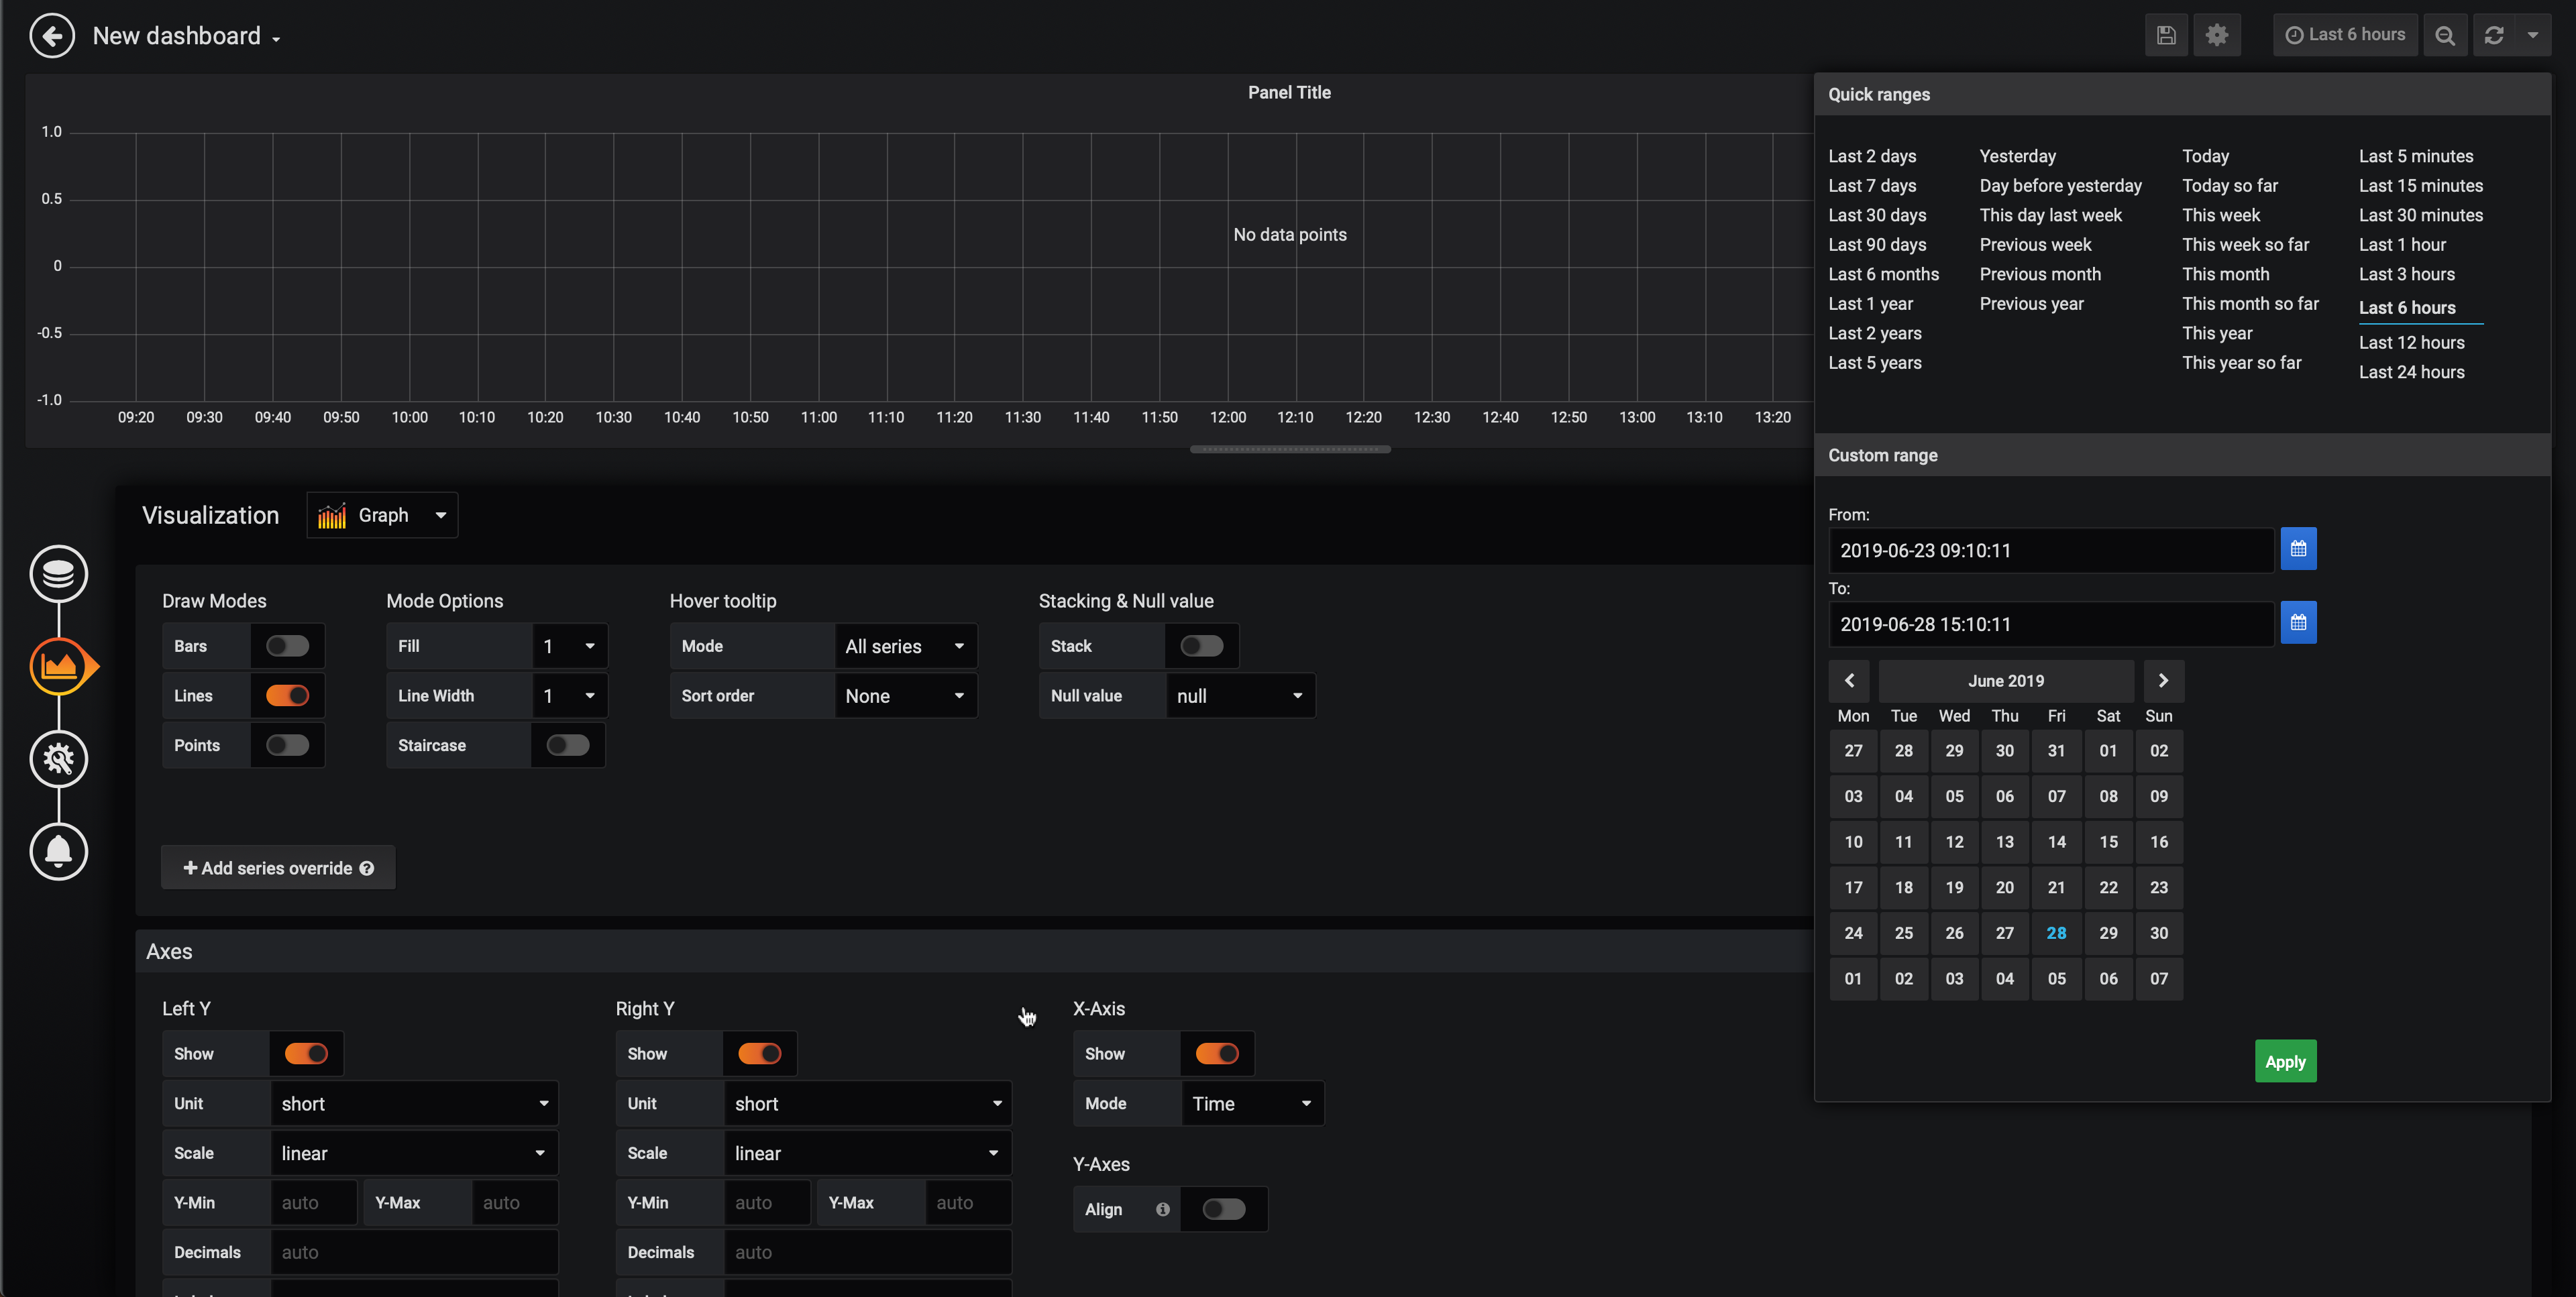
Then, a diagram is displayed in the Grafana dashboard.
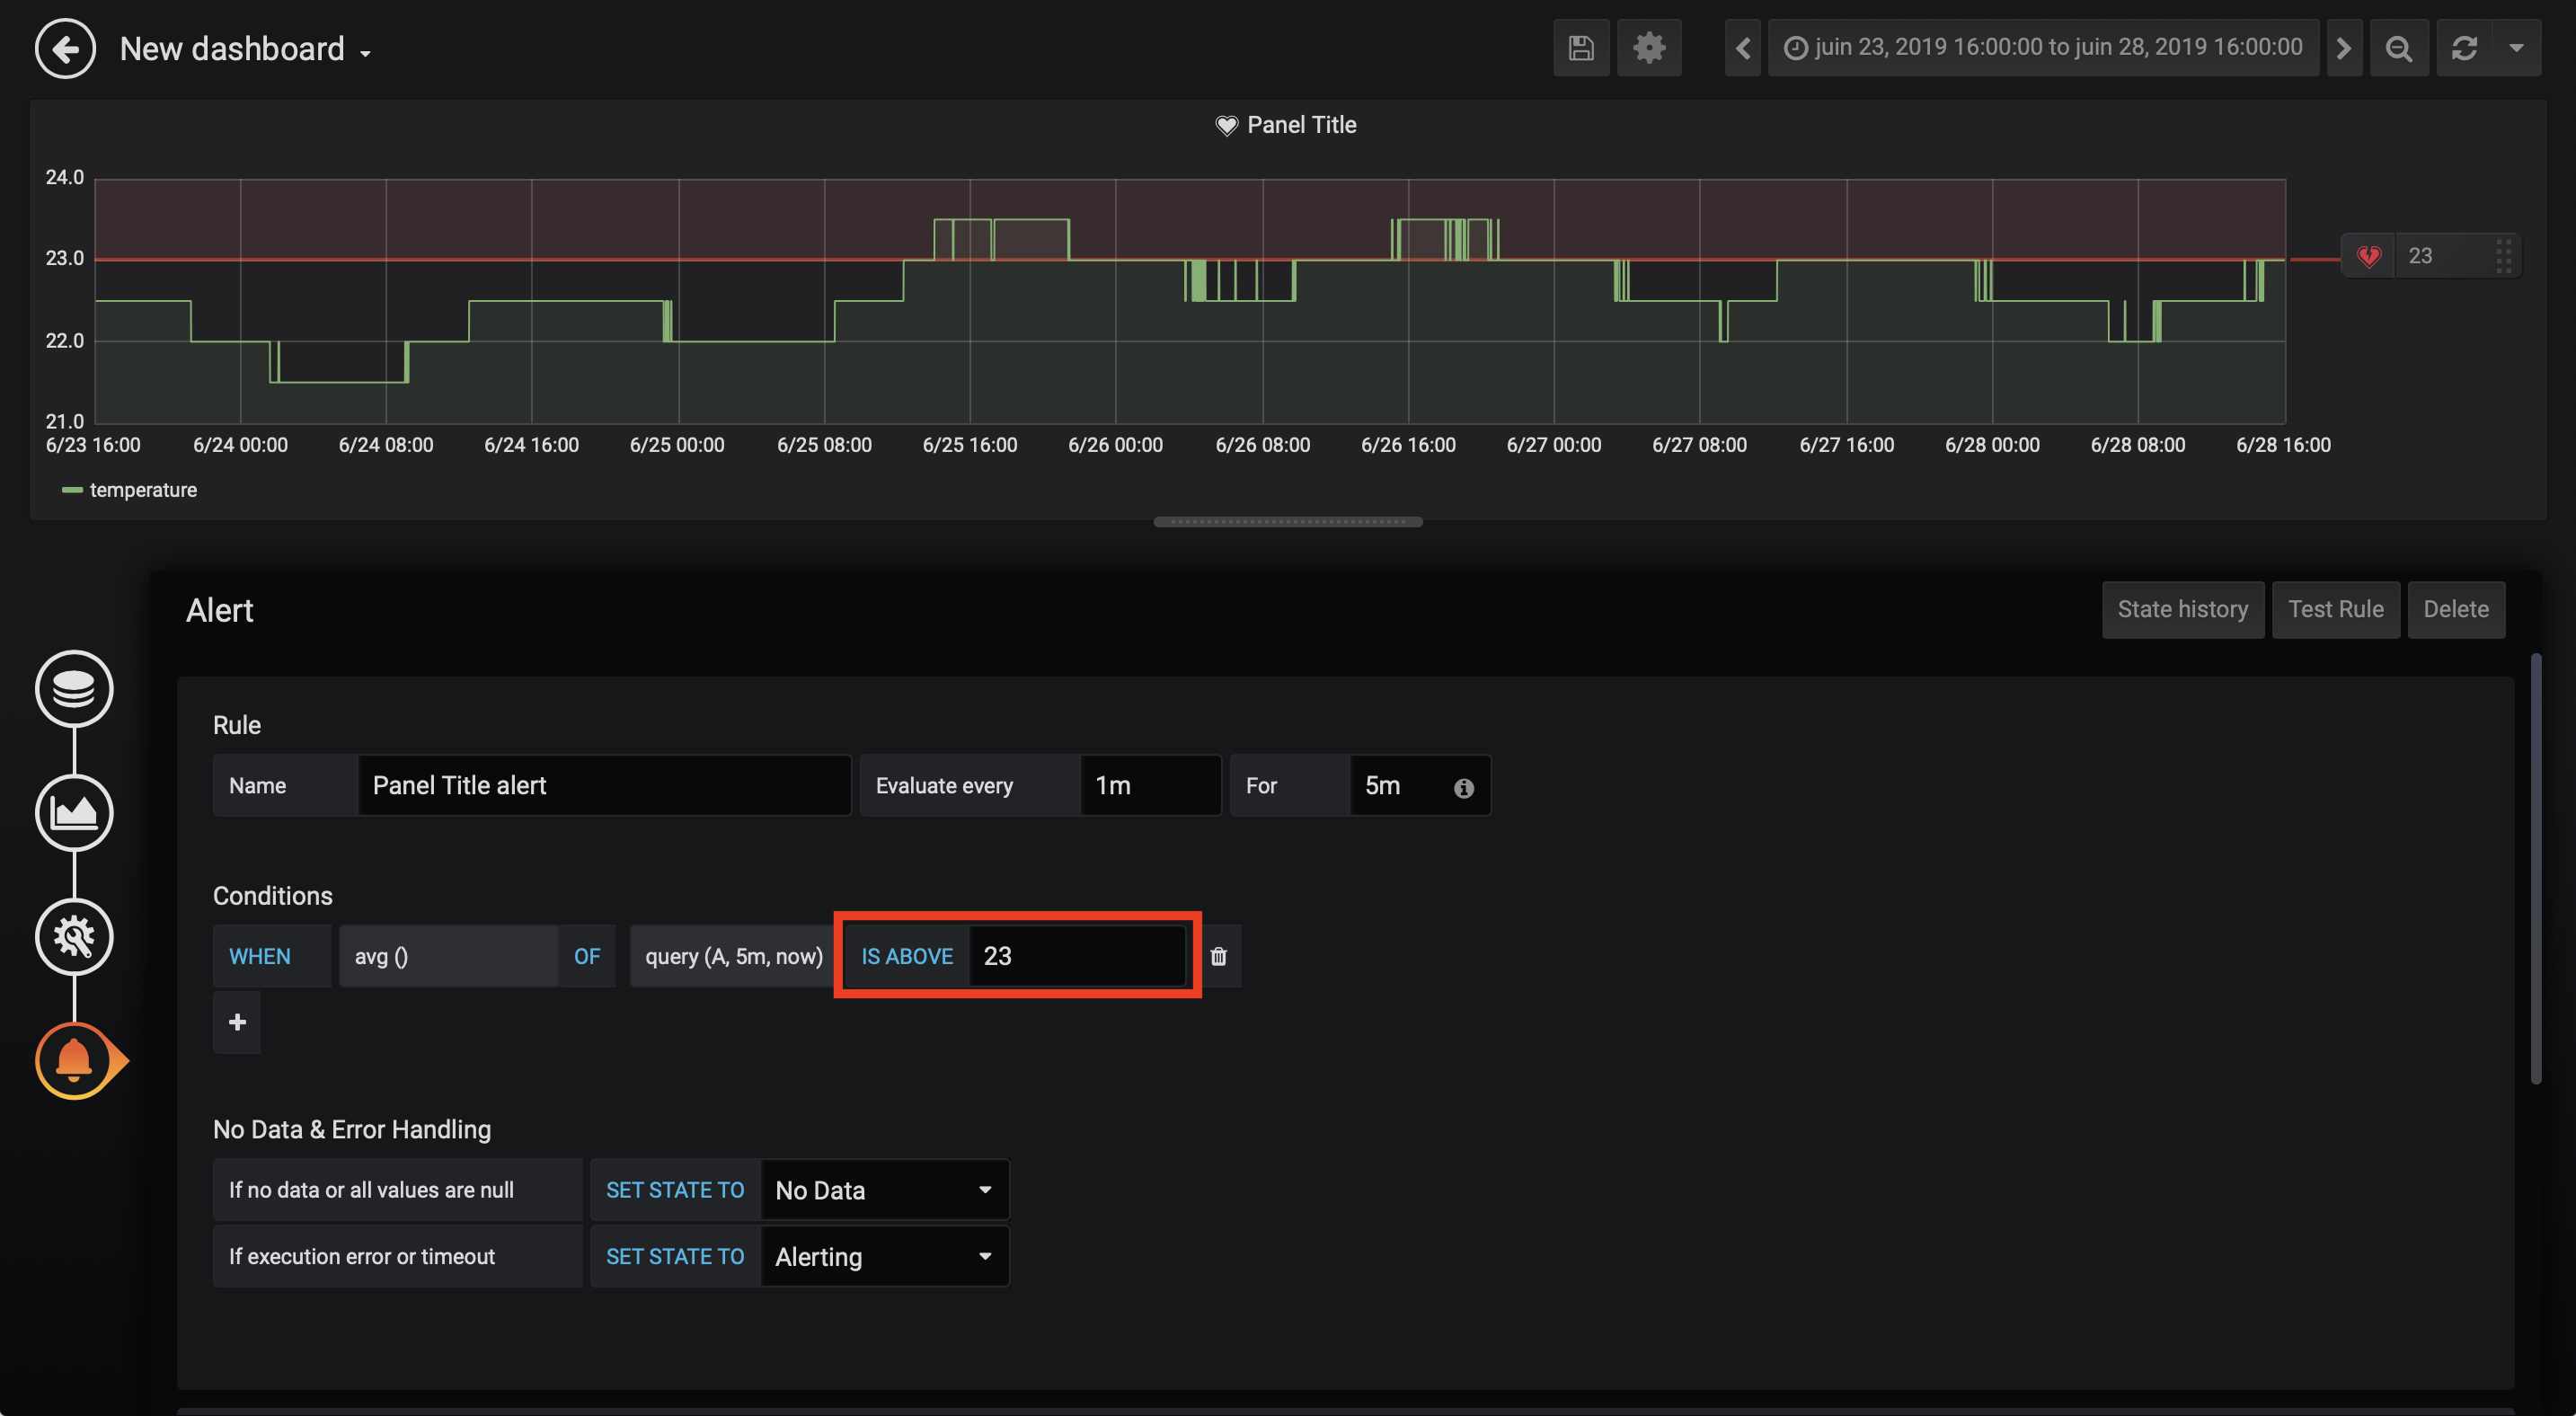
And finally we will configure some alerts using very simple rules:
- Select
Alerttab. - Click on
Create Alert - Specify the alert threshold.
For more information on how to use Grafana, see the official Grafana user guide
5. Explore

“BI tool with a simple interface, feature-rich when it comes to views, that allows the user to create and share dashboards. This tool is simple and doesn’t require programming, and allows the user to explore, filter and organise data.”
Apache Superset provides some interesting features to explore your data and build basic dashboards.
Head to the Superset web interface by typing in your browser the superset.traefikIngress.host. E.g. :
http://superset.example.cetic.be
(the default credentials are admin/Z2JHHezi4aAA):
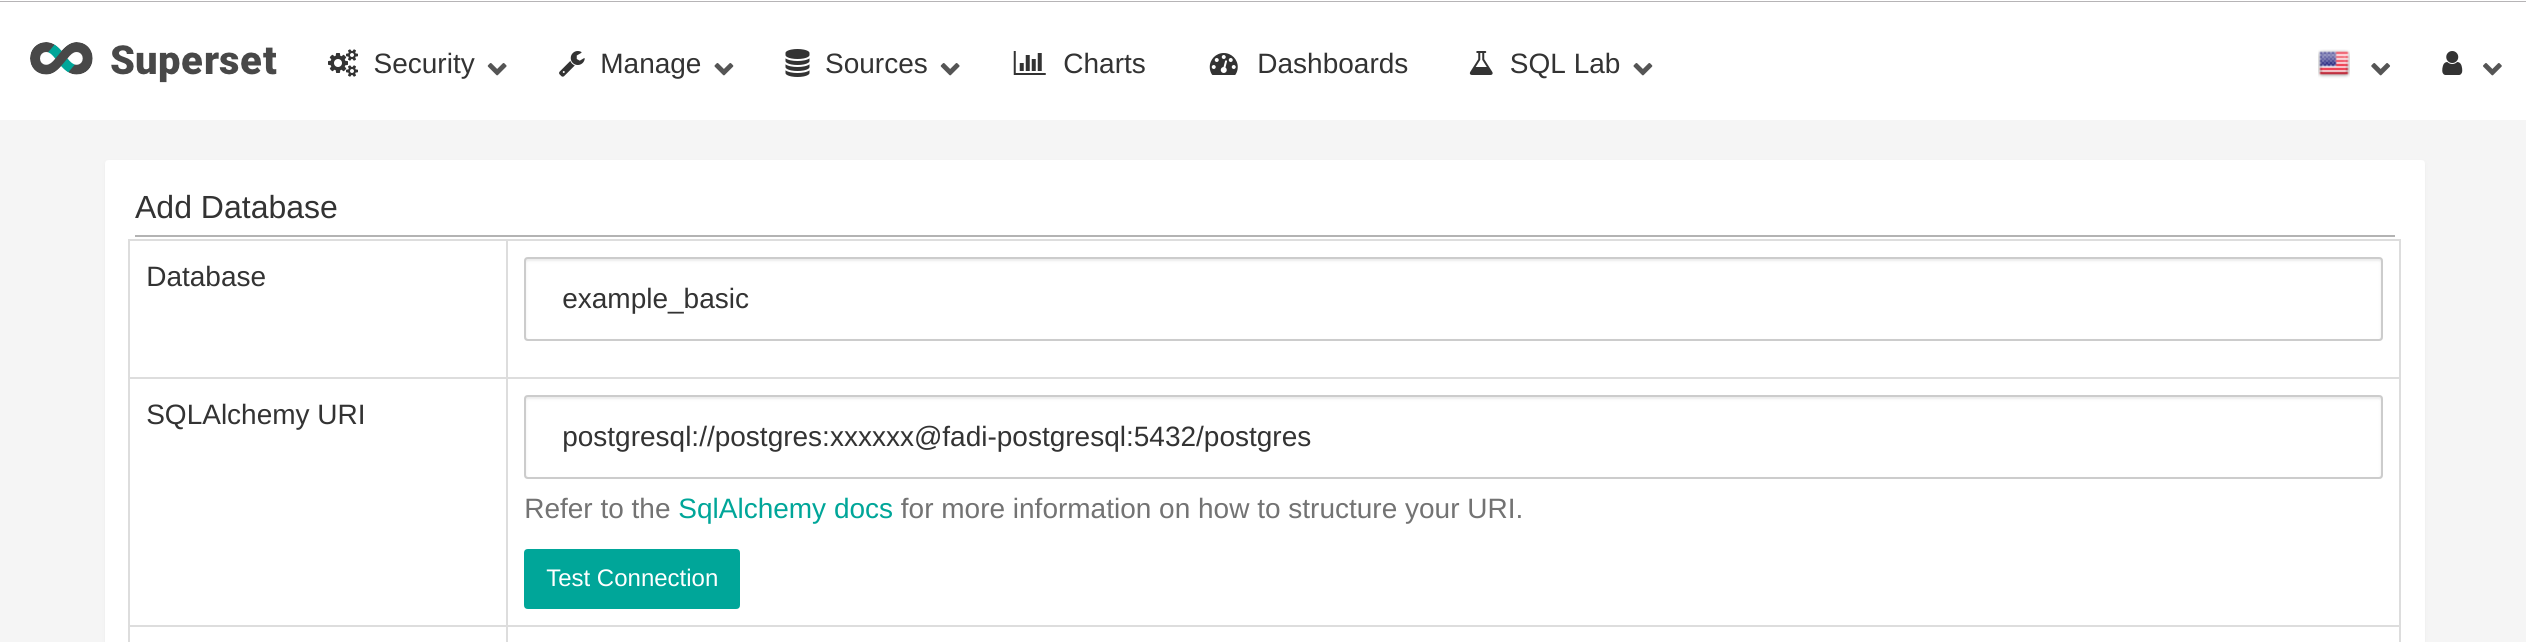
First we will define the datasource:
-
On the top menu of Superset, click on
Sources->Databases - Then, on the right, click on (+) (
add a new recordbutton).- Database:
example_basic - SQLAlchemy URI:
postgresql://admin:Z2JHHezi4aAA@fadi-postgresql:5432/postgres
- Database:
- Finally, you can click on
Test Connectionto check to connection to the database.
- Once the database is created, we can now create a table.
- On the top menu of Superset, click on
Sources->Tables - Click on (+) (
add a new recordbutton). - Database: select
example_basic. - Table name:
example_basic. - Click
Save. - On the table
example_basic, clickEdit recordbutton. - On the
List Columnstab, in themeasure_ts, click on theEdit recordbutton. - In the “Expression” box, enter
measure_ts ::timestamptz. - Click
Save.
- On the top menu of Superset, click on
Then we will explore our data and build a simple dashboard with the data that is inside the database:
- On the top menu of Superset, click on
Charts - Click on (+) (
add a new recordbutton). - Choose a datasource: select
example_basic. - Choose a visualization type:
Time Series - Line Chart. - Click
Create new chart. - In the
Datatab- in
Timesection,- Time Grain:
hour. - Time range:
Last quarter
- Time Grain:
- in
Querysection- Metrics:
AVG(temperature) - Click
Save
- Metrics:
- in
- Then, in the main window of the dashboard, click on
Run Query.
A diagram will be shown.
- We can now save the dashboard, by clicking on
Save.- Save as:
Basic example - Add to new dashboard:
Basic example dashboard - Click on
Save & go to bashboard.
- Save as:
For more information on how to use Superset, see the official Superset user guide
6. Process

“Apache Spark™ is a unified analytics engine for large-scale data processing.”
Jupyter notebooks provide an easy interface to the Spark processing engine that runs on your cluster.
In this simple use case, we will try to access the data that is stored in the data lake.
Head to the Jupyter notebook interface by typing in your browser the jupyter.traefikIngress.host. E.g. :
http://jupyterhub.example.cetic.be
Then, you can login using the default credentials admin/Z2JHHezi4aAA.
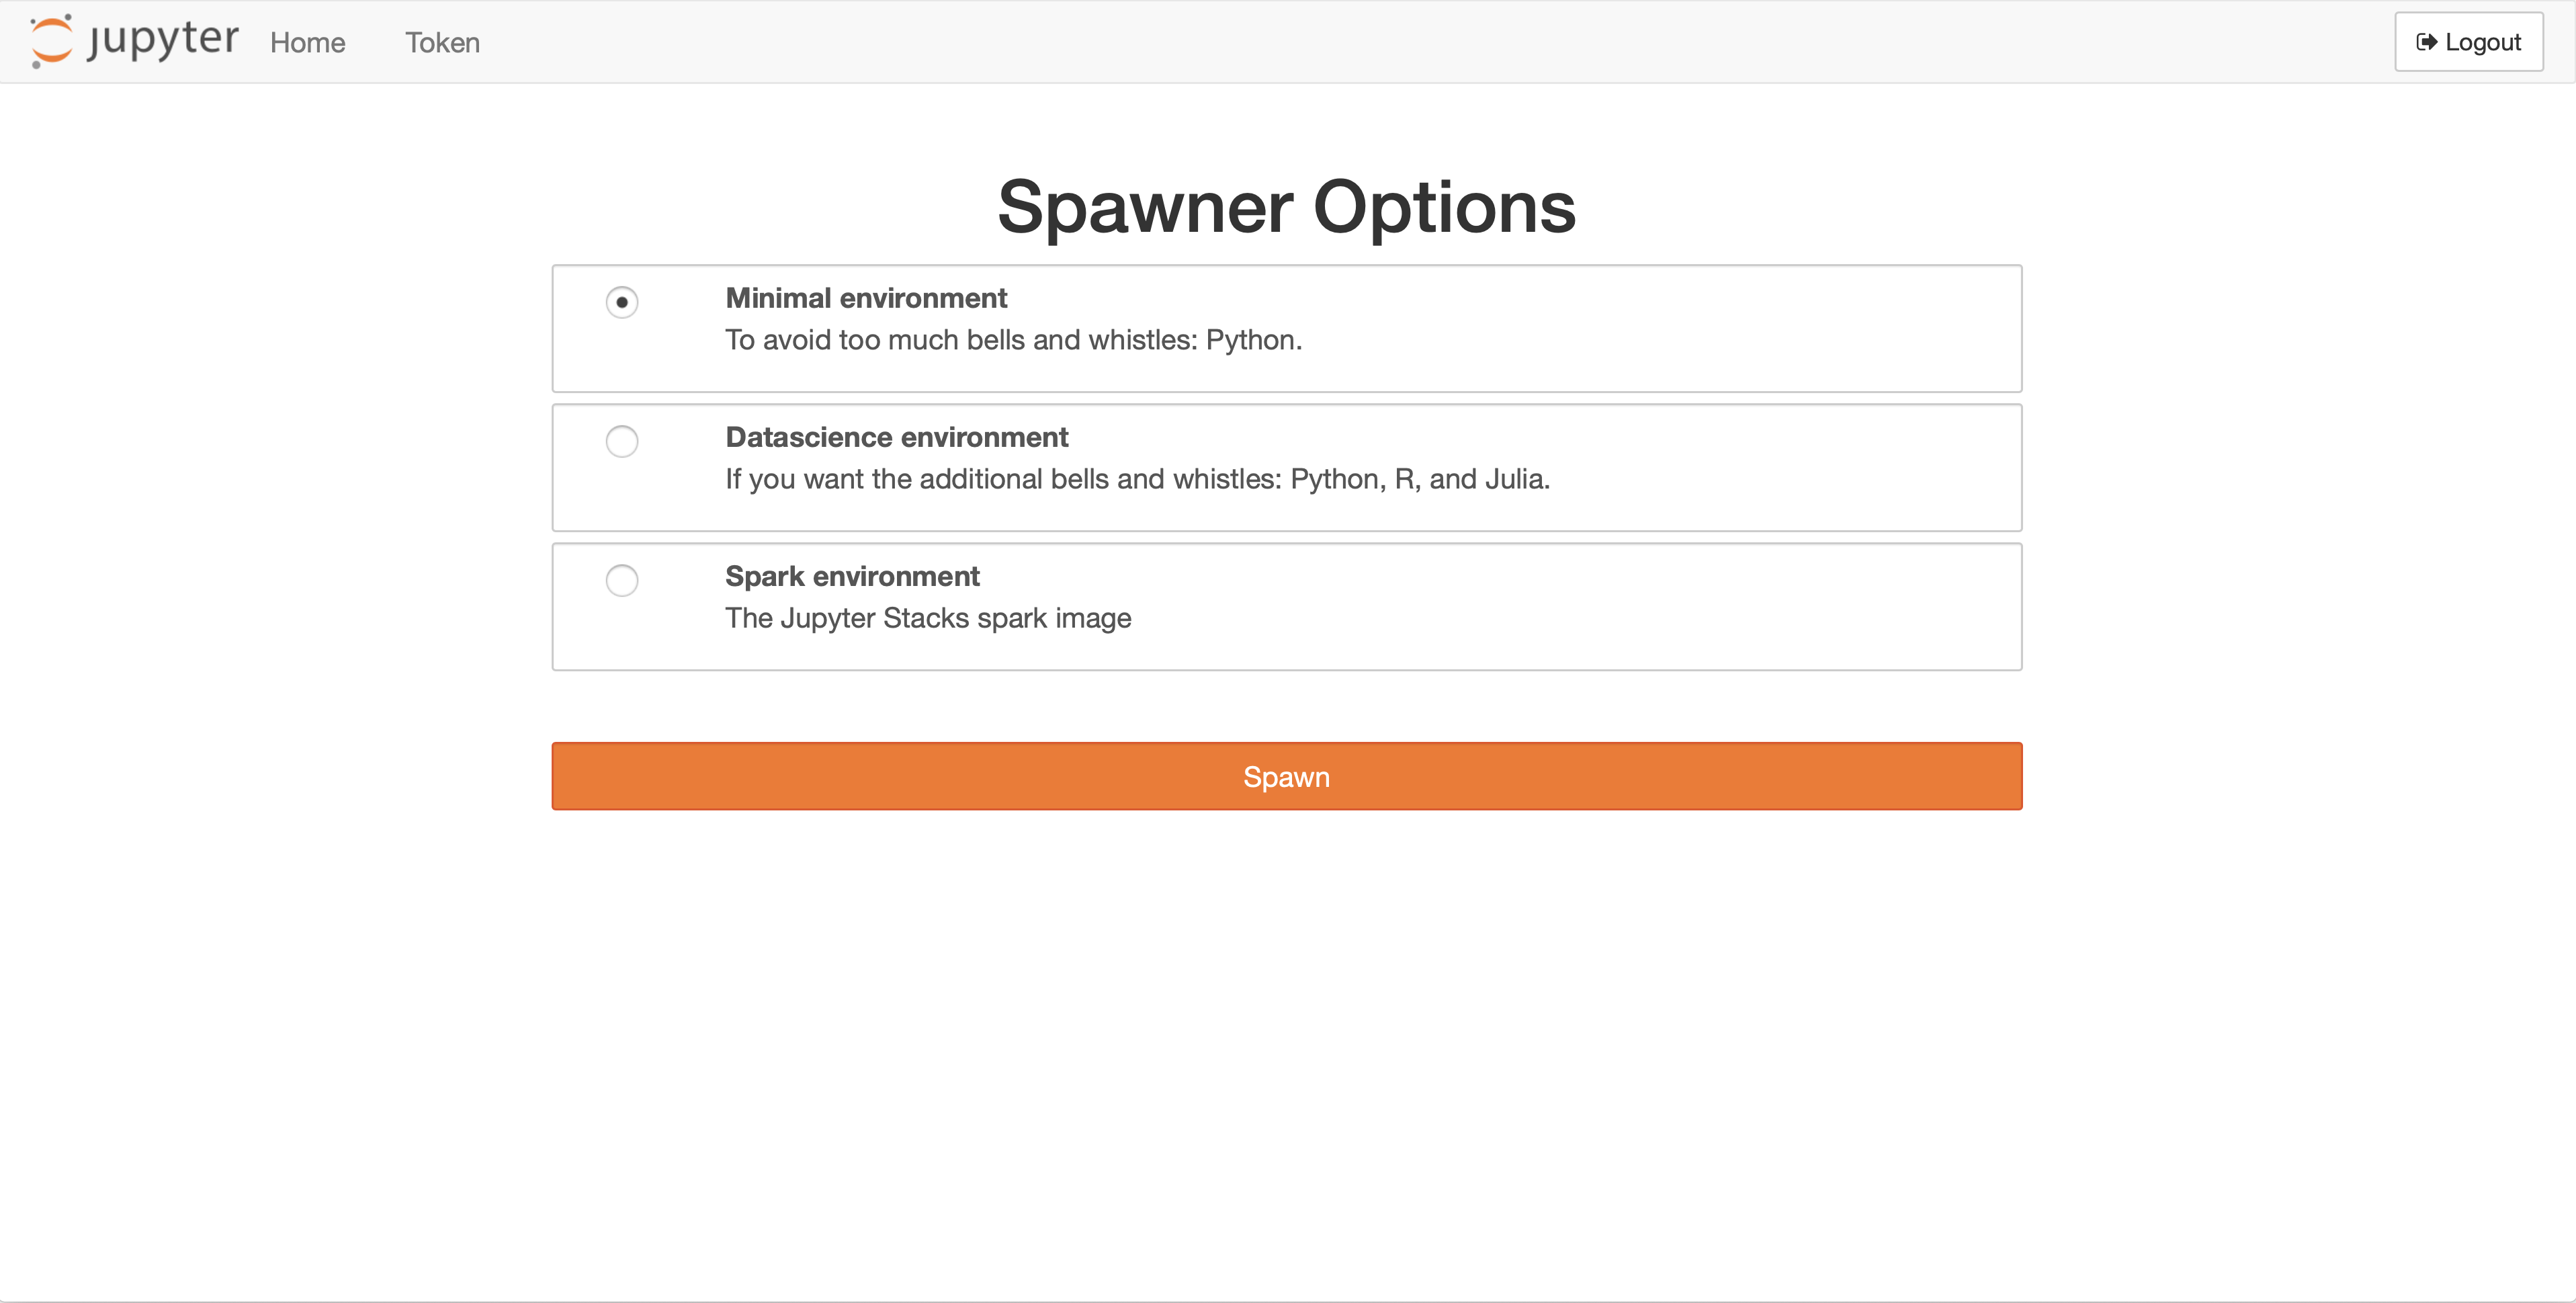
A Jupyter dashboard is shown.
Choose Minimal environment and click on Spawn.
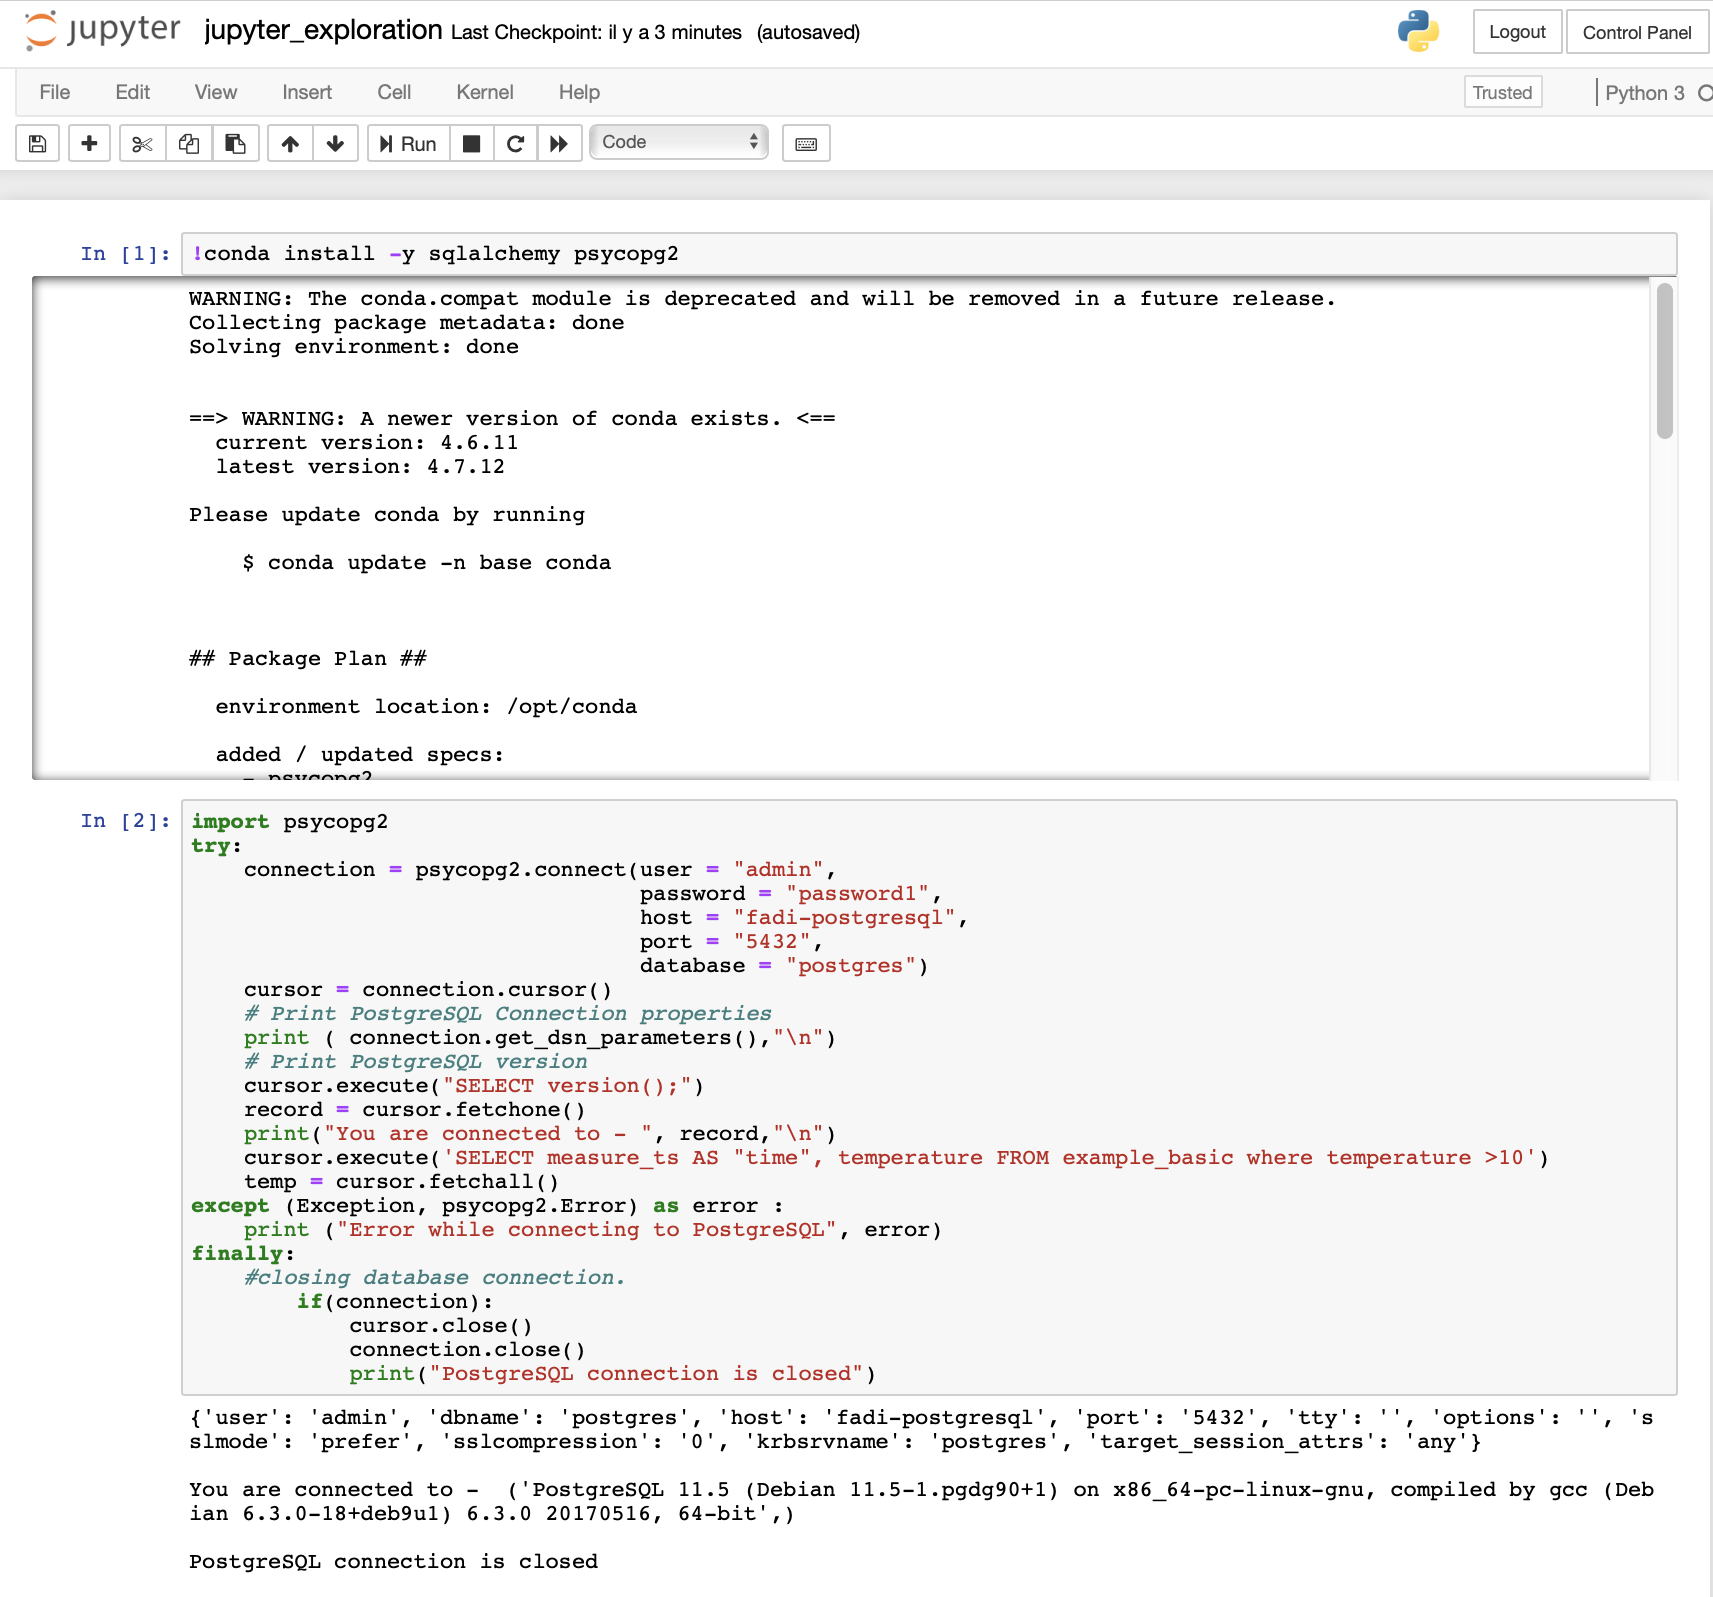
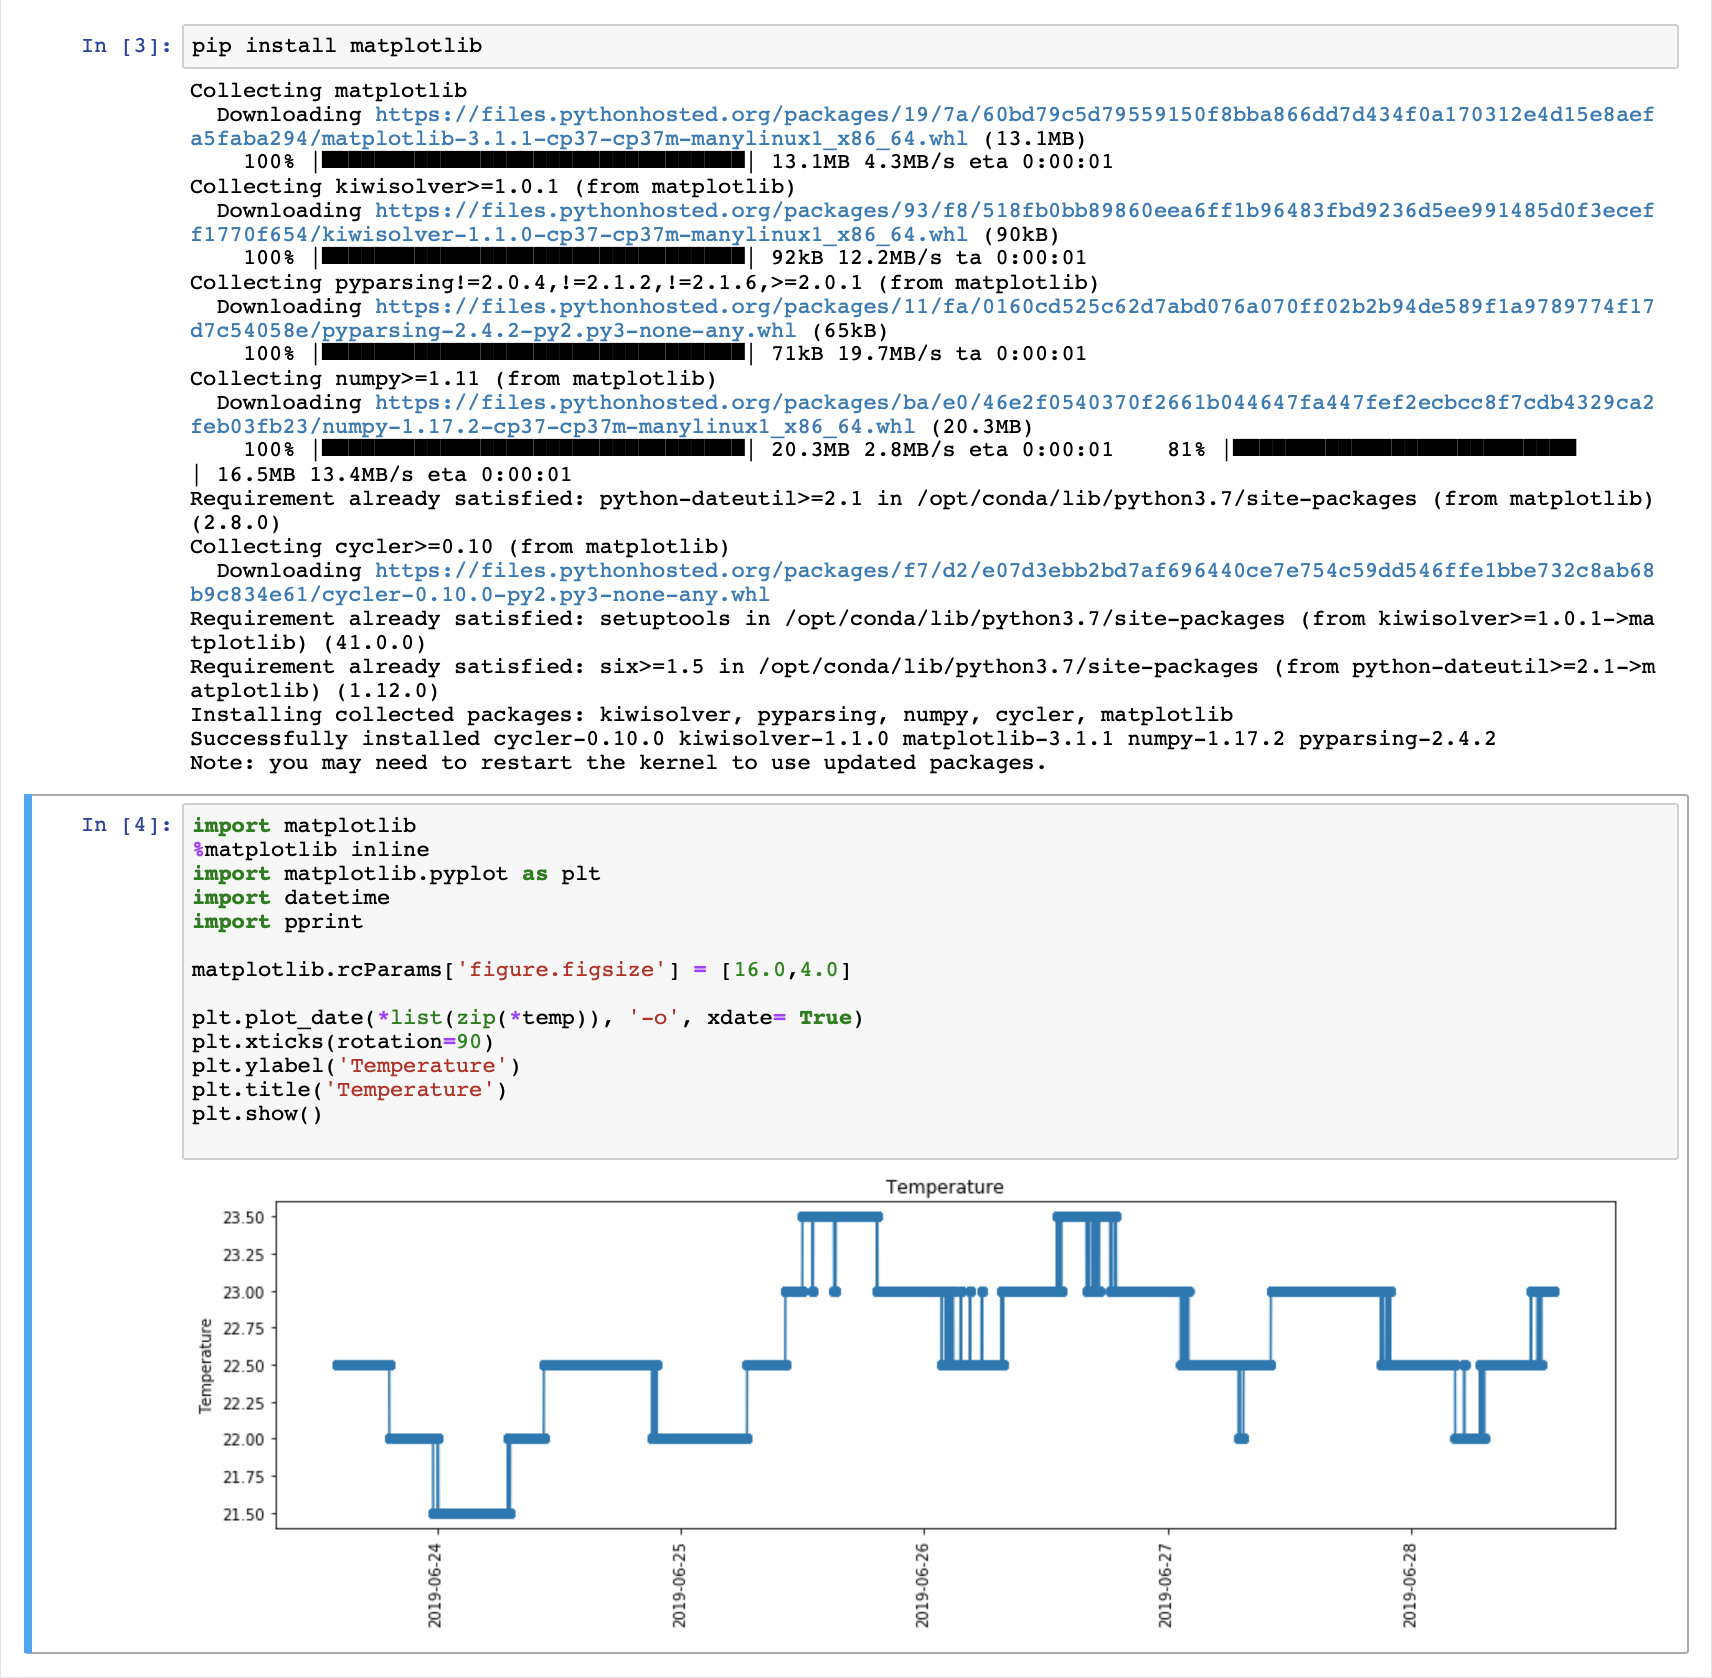
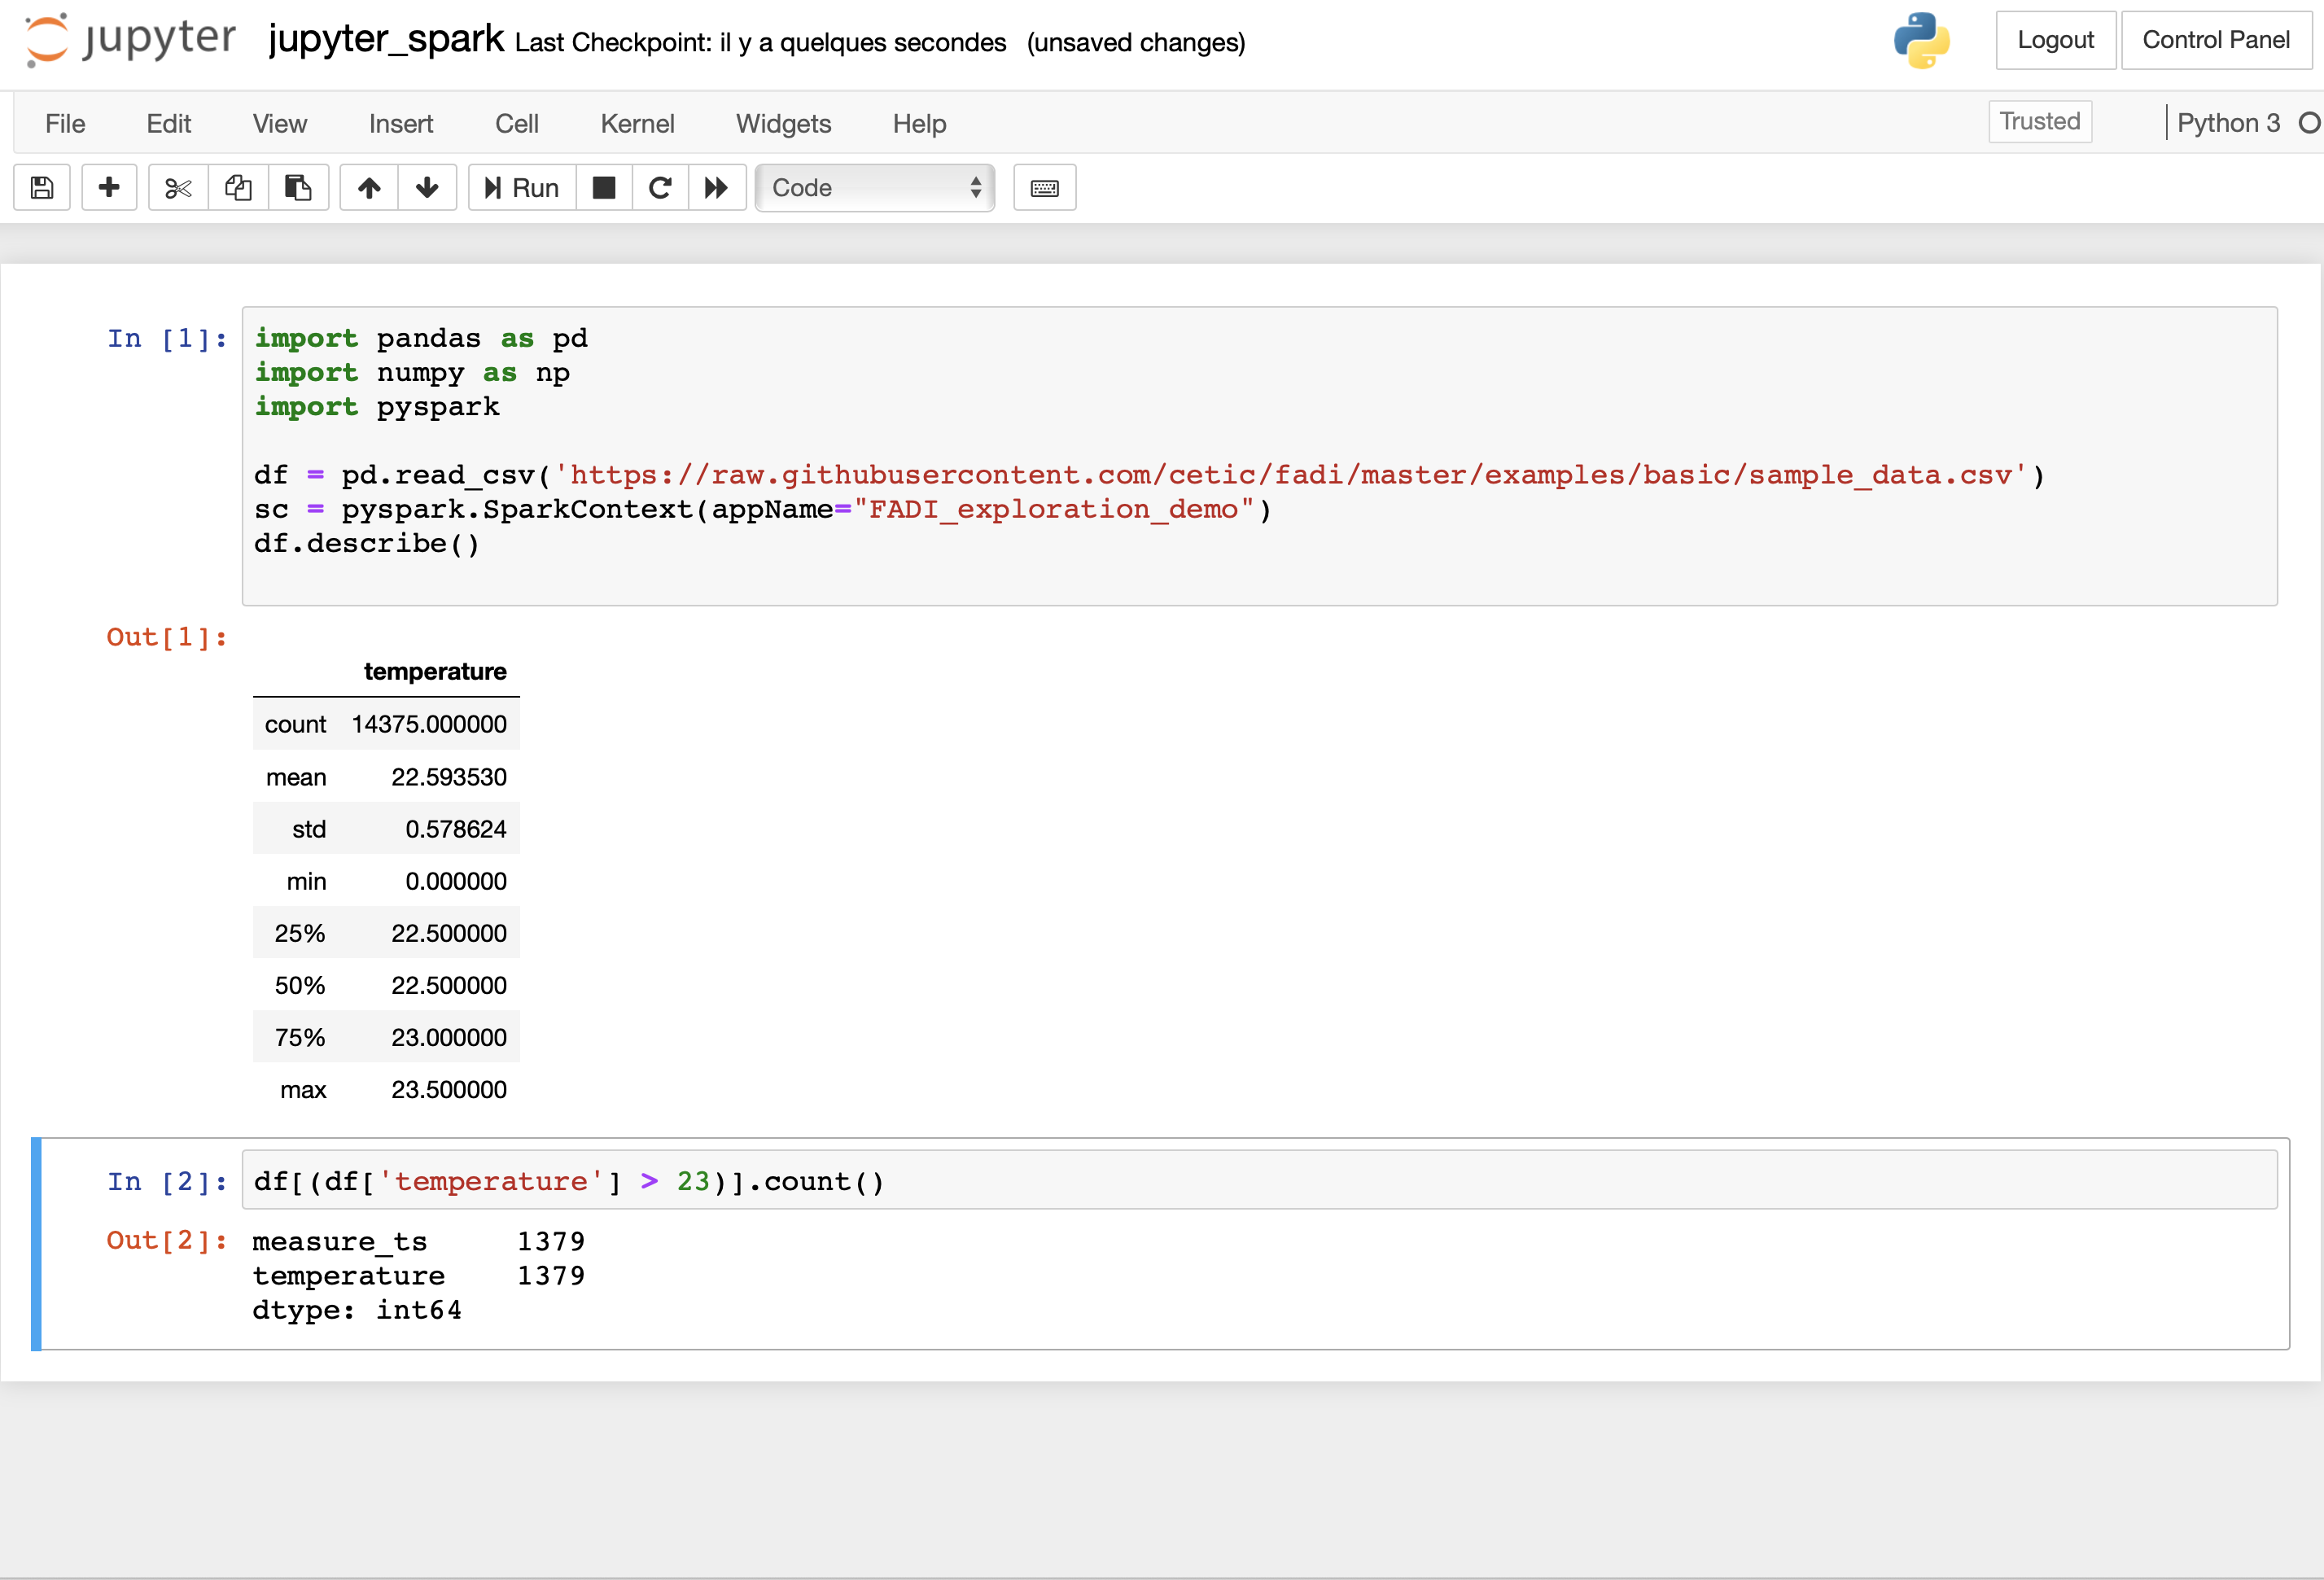
- You can now do some data exploration in the notebook
- At first, you load the sample code:
- Click on the
jupyter_exploration.ipynbmodule and run the different scripts. - You should obtain results similar to that:
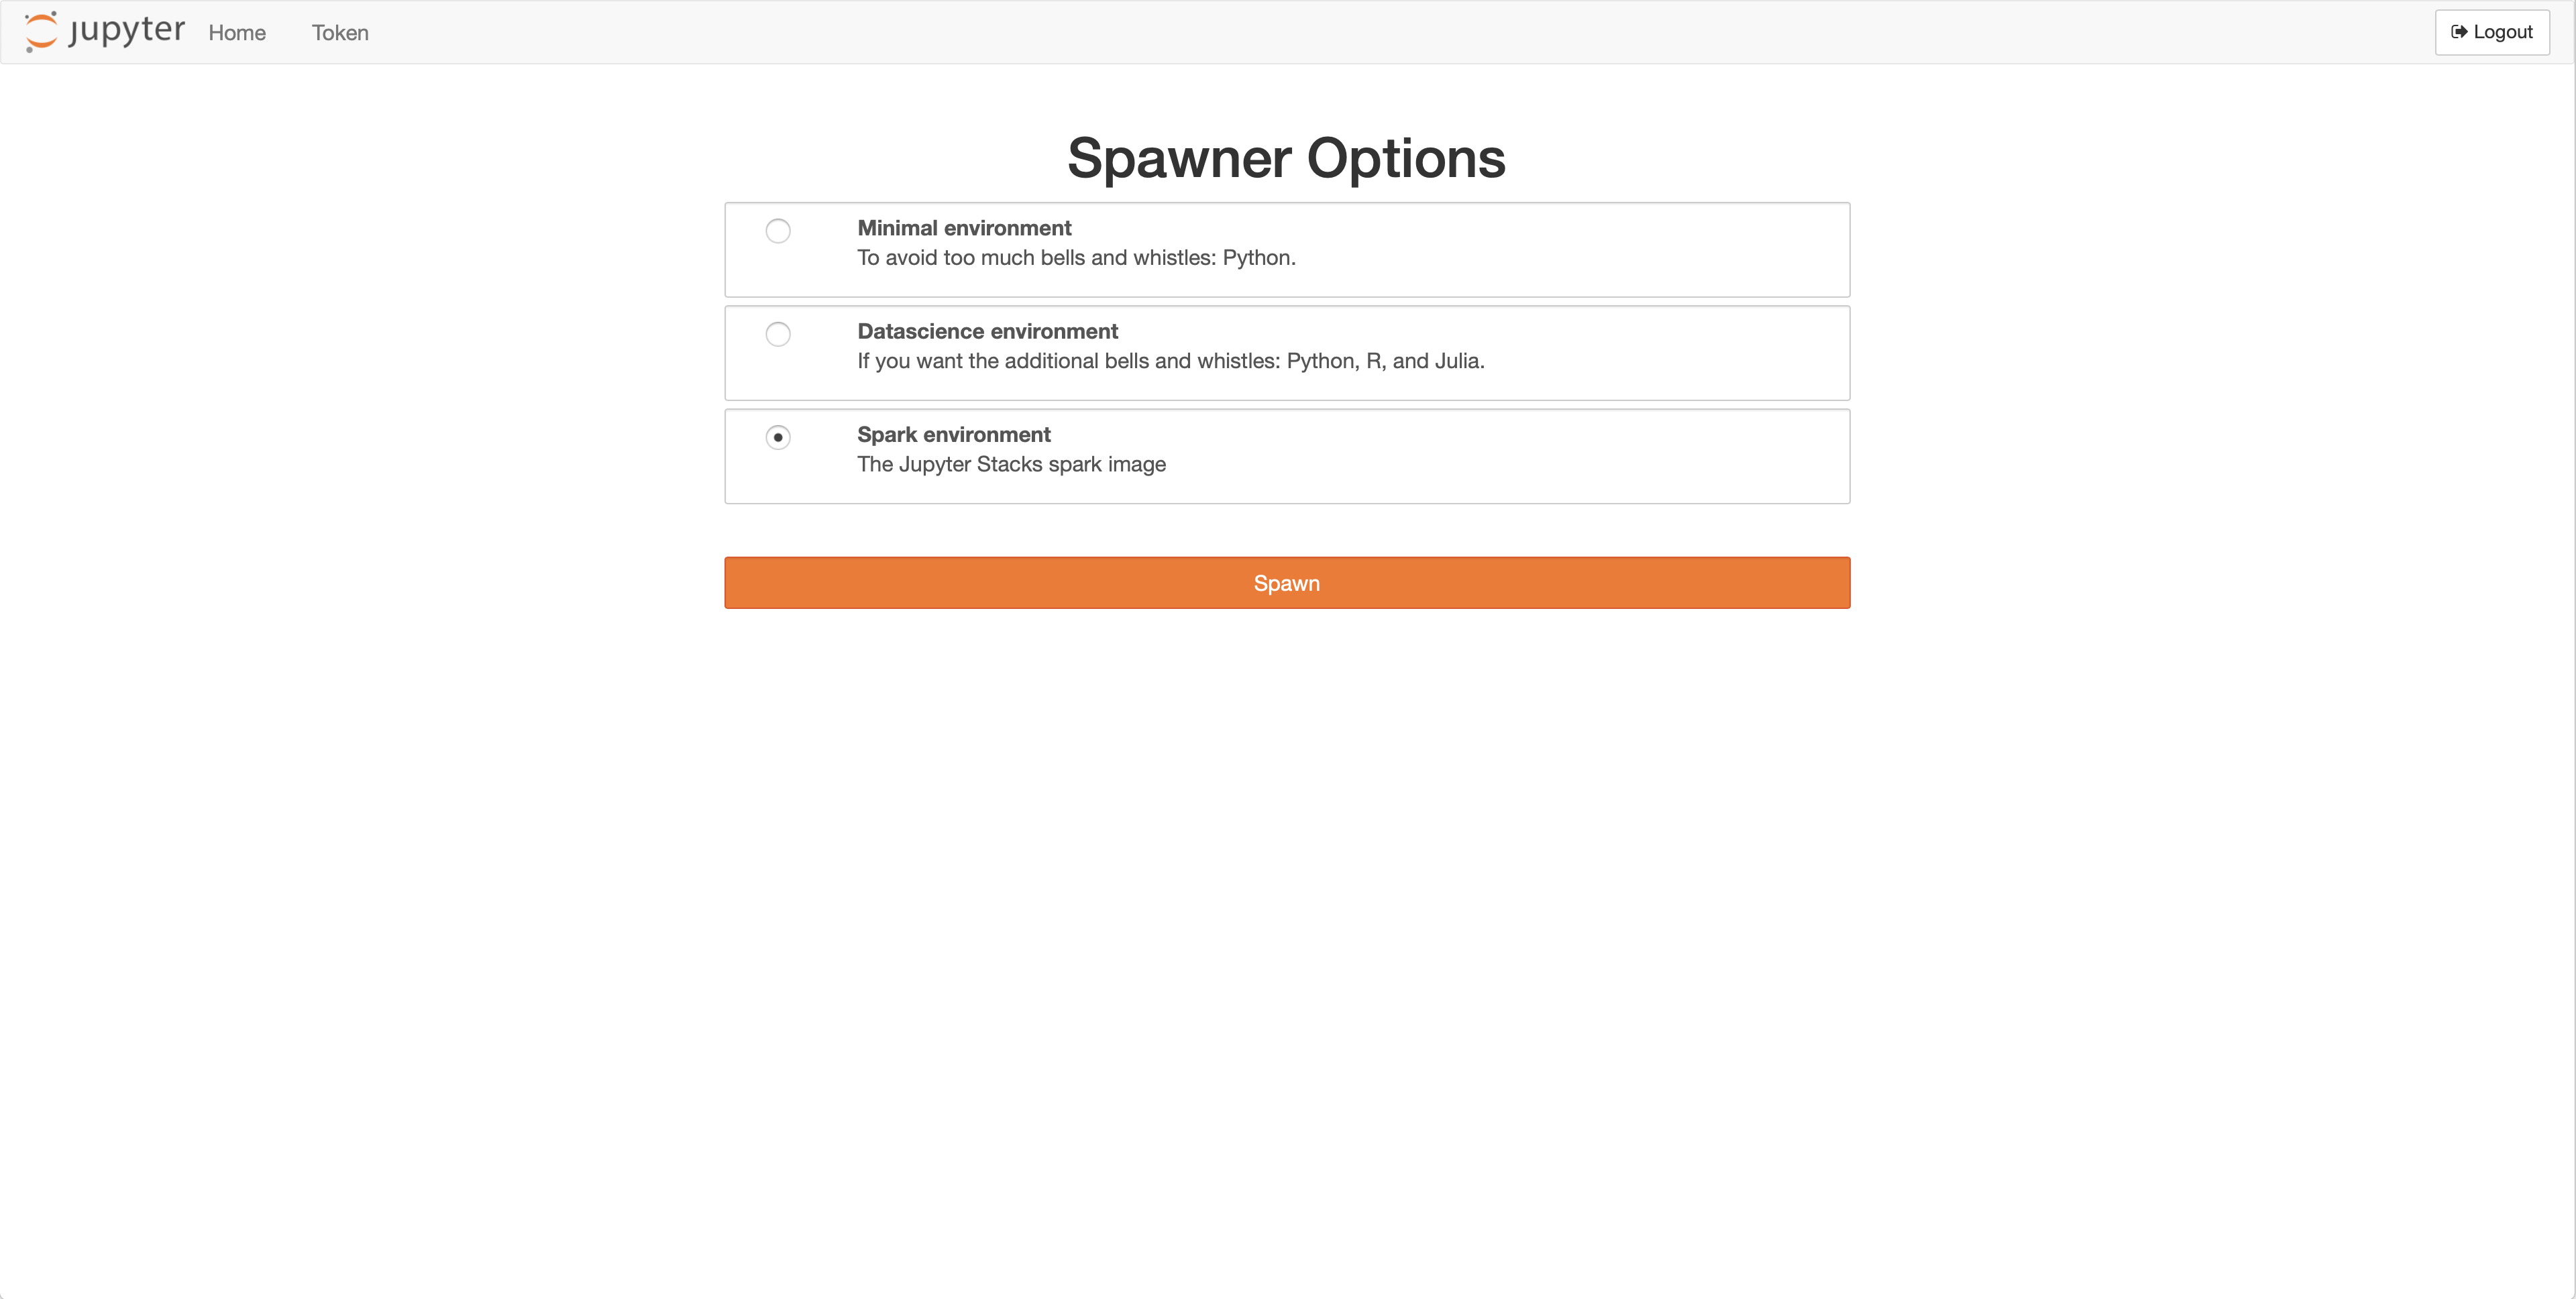
- Now, we will do some Spark processing in the notebook. Before starting, you need to change the environment. So:
- Click on
Control panel - Click on
Stop my server - Finally, click on
Start server, chooseSpark environmentand click onSpawn.
- Click on
- You can now load the sample code
- Run the different scripts
- You should obtain results similar to that:
For more information on how to use Jupyter, see the official Jupyter documentation
7. Summary
In this use case, we have demonstrated a simple configuration for FADI, where we use various services to ingest, store, analyse, explore and provide dashboards and alerts
You can find the various resources for this sample use case (Nifi flowfile, Grafana dashboards, …) in the examples folder
The examples section contains other more specific examples (e.g. Kafka streaming ingestion)